Download
1 / 33
330 likes | 474 Views
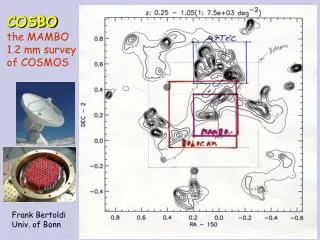
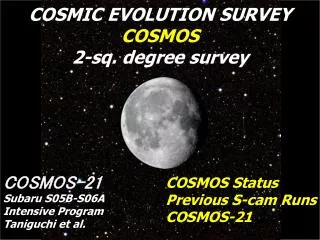
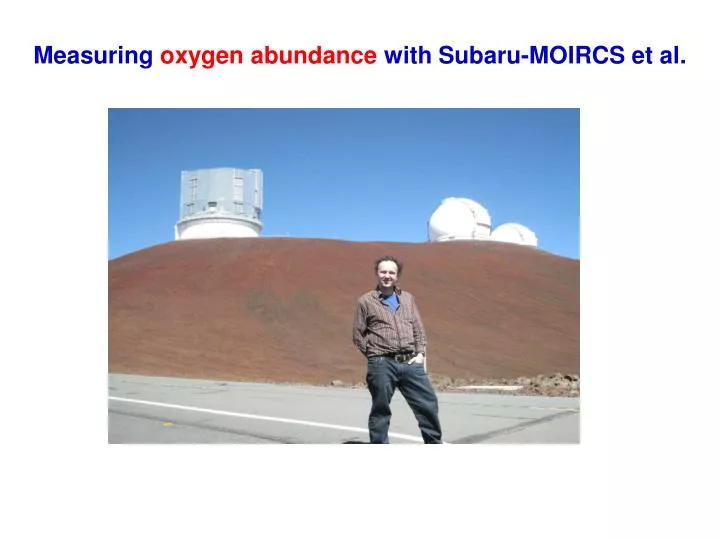
Measuring oxygen abundance with Subaru-MOIRCS et al. Preliminary results of 4 near-infrared spectroscopy programs with VLT and Subaru of zCOSMOS galaxies at 0.5<z<1 and 2<z<2.5 ( PI: C. Maier, ETH Zurich, zCOSMOS data manager ): SUBARU-MOIRCS: 4 half nights in January 2010

E N D
Preliminary results of 4 near-infrared spectroscopy programs with VLT and Subaru of zCOSMOS galaxies at0.5<z<1 and 2<z<2.5 (PI: C. Maier, ETH Zurich, zCOSMOS data manager): • SUBARU-MOIRCS: 4 half nights in January 2010 • VLT-SINFONI: 37 hours observed Jan – April 2010 • VLT-ISAAC P84: 23.5 hours observed Jan – March 2010 • VLT-ISAAC P85: 23.5 hours: observations started in Apr 2010
Near-Infrared spectroscopy with ISAAC of zCOSMOS galaxies at 0.5<z<1 • VLT-ISAAC P84: 23.5 hours Jan – March 2010 • VLT-ISAAC P85: observations started in Apr 2010 • SUBARU-MOIRCS: 5 proposed nights for Jan 2011 • Aim: measure Hα and [NII] in 100 zCOSMOS galaxies • to measure reliable metallicities, which also allows: • to measure SFRs from extinction corrected Hα • to identify Type-2 AGNs using the BPT diagram • to study environment effects (e.g. groups vs. field) on SFRs, metallicities etc.
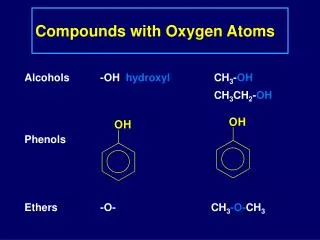
[O/H]-abundance using the R23 method • R23 method was introduced by Pagel et al. (1979) • R23 must be corrected for reddening and degeneracy must be broken using the [NII]λ6584/Hα ratio R23= ([OIII]λλ5007,4959 +[OII]λ3727) / Hβ
[O/H] vs. mass relation of galaxies without near-IR follow-up (only zCOSMOS VIMOS spectroscopy for [OII], Hβ and [OIII]) (a) (b) (c) • Panels a) and b): [O/H] abundances of zCOSMOS galaxies with 3 emission line measured, assuming AV=1, and [NII]/Hα<0.1(lower branch, panel a), [NII]/Hα>0.1 (upper branch, panel b) • Panel c) shows that the assumption of the upper branch is wrong for a substantial fraction of galaxies of these masses based on near-IR follow-up of CFRS galaxies (Maier et al. 2005) need for near-IR follow-up at z>0.5
ISAAC 2010 near-IR spectroscopy of zCOSMOS 0.5<z<1 galaxies: preliminary results • SZ and J-band VLT-ISAAC spectroscopy to measure Hα and [NII] line fluxes for ~40 zCOSMOS galaxies at 0.5<z<1 with [OII], Hβ, and [OIII] from VIMOS optical spectroscopy • Exposure times: 30-60 min in SZ or J band, depending on the Hβ line strength measured with VIMOS (>4*10-17ergs/s/cm2) • The velocity accuracy of ~100km/s of the zCOSMOS spectra allowed us to check that both Hα and [NII] are not affected by strong OH lines (center of line further than 8A away) • X-ray AGNs excluded based on the COSMOS XMM (Brusa et al. 2007) and Chandra (Elvis et al. 2009) observations • ISAAC-P84: candidates for low-metallicity galaxies to determine their number and physical nature: crucial for the mass-metallicity relation at intermediate redshifts • ISAAC-P85: mass-complete sample to disentangle environment effects
Example spectra of zCOSMOS objects at 0.5<z<1 with VLT-ISAAC NIR spectroscopy Hα [NII]
Comparison of SFR from 24μm (Paschen-α) and SFR from Hα • one of the best-understood SFR indicators is Hα: the Hα extinction corrected luminosity is directly proportional to the hydrogen-ionizing radiation from massive stars • SFR from IR (Emeric Le Floc’h): a) convert the rest-frame 8 μm luminosity to a dust-corrected Paschen-α lumi-nosity using the calibration from Calzetti et al. (05) and Dias-Santos (09) b) convert this to SFR using a calibration from Osterbrock (1989)
The metallicity-mass relation using near-IR spectroscopy • Reliable [O/H] abundances of zCOSMOS 0.5<z<1 galaxies using an chi2 analysis by simultaneously fitting the 5 emission lines in terms of [O/H], extinction and ionization parameter, using the models of Kewley and Dopita (2002), as described in Maier et al. (2005)
Preliminary results with ISAAC 2010 data: Size-metallicity relation • Half-light radius from GIM2D Sersic fits done by Sargent et al. (2007) • Higher [O/H] in larger galaxies: to be confirmed with all ~40 ISAAC observed galaxies
Near-Infrared spectroscopy with SINFONI and MOIRCS of zCOSMOS galaxies at 2.1<z<2.5 • SUBARU-MOIRCS: 4 half nights end of January 2010 • VLT-SINFONI: 37 hours observed Jan – April 2010 • Aim: measure [OII] (J-band), Hβ and [OIII] (H-band) Hα and [NII] (K-band) in 2.1<z<2.5 zCOSMOS galaxies • to measure reliable metallicities, which also allows: • to measure SFRs from extinction corrected Hα • to identify Type-2 AGNs using the BPT diagram • to study environment effects (e.g. groups vs. field) on SFRs, metallicities etc.
Metallicities at 2<z<2.5 • The five lines required to use the R23 method breaking the high/low branch degeneracy are [OII] in J-band, Hβ and [OIII] in H-band, and [NII] and Hα in K-band • The chance of having all five lines clear of OH line is not so high, <50% as shown in the figure • Not one of the pioneering studies of metalllicities at z>2 has measurements of all five lines, and only a handful have measurements of even four or three lines (four galaxies of Erb et al. 2006, five of Pettini & Pagel 2004, two LSD galaxies of Mannucci et al. 2009, and a couple AMAZE objects) redshift
4 half nights Subaru-MOIRCS in January 2010 • MOIRCS (multi-object infrared camera and spectrograph) at Subaru: field of view of 4x7 square arcminutes • resolution with 0.8 arcsec slit: R~950 in K (Hα and [NII] at z~2.3), and R~1900 in J ([OII]) and H (Hβ and [OIII] ) using new VPH-J and VPH-H grisms
4 half nights Subaru-MOIRCS in January 2010 • one mask MOIRCS (9-10 main targets + several additional targets) in 4 half nights (~6 hours exposure time in each K, H, and J) • observations done under reasonable weather conditions, data are being reduced, but no official MOIRCS pipeline I am using Yoshikawa pipeline (but description in Japanese, so progress slow) • Additional issue: higher resolution VPH-J and VPH-H grisms: wavelength sensitivity dependent on position of object on the mask • difficult to find best pointing to maximize number of targets and optimize the wavelength sensitivity I used two masks with slightly shifted object positions in J and H to optimize this for [OII] in J, Hβ and [OIII] in H • calibration with standard star more difficult: I had to observe a standard star at different position on the chip (corresponding to positions of targets) to account for the wavelength dependence of the VPH grisms: larger overhead of the observations, and data reduction more complicated
4 half nights Subaru-MOIRCS in January 2010 Preliminary reduction: example of z~2.2811 zCOSMOS galaxy J-band [OII] HβH-band [OIII]b [OIII]a K-band Hα zCOSMOS VIMOS spectrum ACS image
SINFONI non-AO program: JHK spectroscopy at z~2.3 • 37 hours SINFONI non-AO in P84, observations January-April 2010 (just finished in April 2010) : 40 min in K, 1h in H, 1h in J • a dozen of zCOSMOS-Deep 2<z<2.5 galaxies, including 3 objects with K-band observations from SINFONI Large Program LP (PI: A. Renzini) • Selection: SFR from COSMOS SED > 43Msun/yr expected Hα flux >10*10-17 ergs/s/cm2) + not expected to be affected by OH line • However: zCOSMOS-Deep redshift accuracy ~300km/s, and absorption lines (UV with VIMOS) can show significant velocity offset with respect to emission line gas (e.g. seen in SINS, Forster-Schreiber et al. 2009) • iterative scheme: first measure Hα with SINFONI for 15 objects in K-band, then use the detection/non-detection + emission line redshift to select the best (handful of) SINFONI targets for which all 5 lines can be observed
VLT-SINFONI non-AO: examples of two zCOSMOS galaxies with 5 lines measured z=2.2450 (upper panels) and z=2.4579 (lower panels) J-band [OII] | HβH-band [OIII]a | K-band Hα [NII]
Overview detections in Hα from SINFONI and MOIRCS • SINFONI LP, SINFONI P84/85 metallicity program, MOIRCS galaxies with Hα detected (filled symbols) and Hα not-detected (open symbols) • 12/15 SINFONI P84 galaxies detected in Hα, 8 MOIRCS galaxies detected in Hα • Non-detections because of bad seeing, low surface brightness, wrong SFR from SED and/or OH lines
Overview detections in Hα from SINFONI and MOIRCS • SINFONI LP, SINFONI P84/85 metallicity program, MOIRCS galaxies with Hα detected (filled symbols) and not-detected (open symbols) • 12/15 SINFONI P84 galaxies detected in Hα, 8 MOIRCS galaxies detected in Hα • Non-detections because of bad seeing, low surface brightness, wrong SFR from SED and/or OH lines
Oxygen abundance vs. stellar mass at z~2.3 • Data reduction ongoing; 3 preliminary points from SINFONI z~2.3
Metallicities at 2<z<2.5: anomalous line-ratios • For 87 galaxies at 2<z<2.5, Erb et al. (2006) used the N2 method (based on the [NII]/Hα ratio) to estimate oxygen abundances, a controversial method plagued by uncertainties in reddening and ionization level, claimed to be unreliable by some authors (e.g. Shi et al. 2007) • Only 4 of the 87 galaxies have [OIII] and Hβ line fluxes measured additional to [NII] and Hα • These 4 galaxies lie in the region of the BPT diagram occupied by composite active nucleus – HII galaxies; they do not follow the local excitation sequence from SDSS
BPT diagram at z<1 • solid line: maximum theoretical starburst line of Kewley et al. (2001): star-forming galaxies fall below and to the left of this line • dashed line: a similar, empirical determination by Kauffmann et al. (2003)
BPT diagram at z<2.5 • Some galaxies fall between the two lines: why? (to be analysed with the zCOSMOS data) • They could be composite AGN, or could have different ionization parameters ([OIII]/[OII]) due to changes in the stellar populations (ionizing spectrum) and gas content of the galaxies
Next steps • calculate metallicities with 5 emission lines at z~2.3, and enlarge sample at z<1 (reduction of data ongoing) • compare SFR for all ~40 galaxies from extinction corrected Hα, SFR from [OII] and from mid-infrared COSMOS observations (Paschen-α) • better statistics to study group/field dependence of [O/H], SFRs etc. with more reduced data • data are fresh: January-June 2010 • benchmark for galaxies where Hα on night sky lines • use MOIRCS, LUCIFER, KMOS to enlarge these samples with the wealth of information of the COSMOS survey
Pegase models • Maier et al. 2005: Pegase models with SFR~exp(-t/t1)/t1, assuming the galaxy is built up by continuous infall of primordial gas with an infall rate ~exp(-t/tinf)/tinf; Models with tinf<<t1: closed-box like
Equation of cosmic chemical evolution Fall and Pei (1993): equations of cosmic chemical evolution • 1.equation: Conservation of mass: d/dt(g+s)=d/dt(f) , where g/s is the density parameter in gas/stars, and d/dt(f) the rate of infall/expulsion of baryonic material from galaxies • 2.equation: The rate at which the mass of heavy elements changes with time: d/dt(m) = d/dt(Z . g)=y.d/dt(s) - Z.d/dt(s) + Zf .d/dt(f), where m is the density parameter in heavy elements, y the yield, Z the metallicity • Closed Box Model: no infall/expulsion of matter from/ into IGM , Z=-y . ln(g(z)/g(initial)) Infall Model: infalling matter consists of unenriched primordial material gas
Oxygen abundances: Direct calibration • Abundance of any ion (e.g. O+) relative to H+: X(O+)/X(Hb) = I(3727)/I(Hb)*e(Hb)/e(3727); Hydrogen assumed to be completely ionized abundance relative to hydrogen from summing over all ionization states • Relative rates of excitation of the 1S and 1D levels depend very stongly on the electron temperature Te • From the ratio of [OIII]b+[OIII]a/[OIII]4363 Te [O++], Te [O+] e(l) O/H • Temperature sensitive line [OIII]λ4363 line too weak to be detected at medium z no direct calibration possible • Energy level diagram for O2+
SFRs derivation for zCOSMOS galaxies at 0.5<z<0.9 • for this study I used the [OII]-SFR calibration by Moustakas et al. (2006), which takes dust extinction and metallicity into account, using a correction dependent on the galaxy’s restframe B-band magnitude • one of the best-understood SFR indicators is Hα: the Hα extinction corrected luminosity is directly proportional to the hydrogen-ionizing radiation from massive stars • drawback: Hα is redshifted out of the optical window beyond z~0.5 need near-infrared folllow-up
Gas metallicities at z>0.5 using near-IR spectroscopy • Maier, Lilly et al. 2005, ApJ, 634, 849 : ISAAC near-IR spectroscopy of 0.5<z<1 CFRS galaxies • measurements of Hα and [NII] line fluxes for CFRS galaxies with [OII], Hβ, and [OIII] from optical spectroscopy (Lilly et al. 2003) • about one third of the CFRS galaxies have lower metallicities than local galaxies with similar luminosities (masses); can still be however on the upper branch or turn-around region of R23 relation
CFRS galaxies with reliable [O/Hs] (Maier et al. 2005): morphology and environment information was missing available for zCOSMOS galaxies
Concordance cosmologyRedshift Look-BackTime (Gyrs) Age Universe(Gyrs) 0.01 0.2 13.3 0.03 0.5 130.1 1.5 12 0.2 2.5 11 0.3 3.5 10 0.42 4.5 9 0.56 5.5 8 0.73 6.5 7 0.93 7.5 6 1.38 9 4.52.1 10.5 3 3.1 11.5 2 4.8 12.25 1.2 5.6 12.5 1 6.6 12.65 0.8 9.46 13 0.5