Download
1 / 32
320 likes | 546 Views
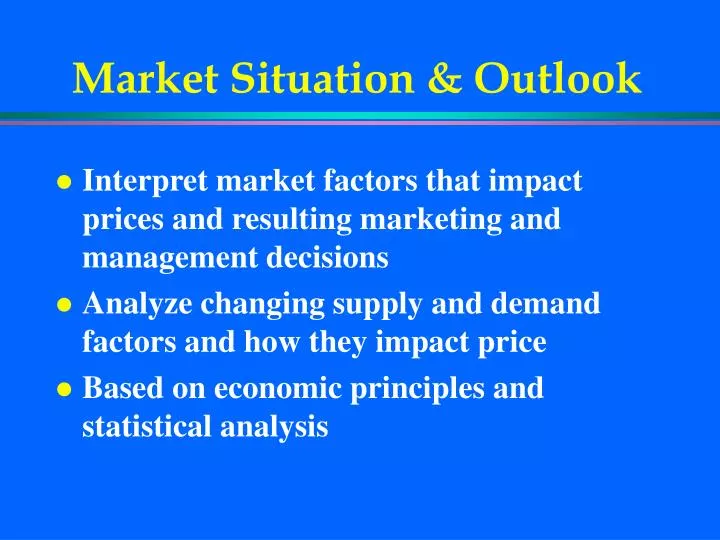
Market Situation & Outlook. Interpret market factors that impact prices and resulting marketing and management decisions Analyze changing supply and demand factors and how they impact price Based on economic principles and statistical analysis. Limitations. Efficient market hypothesis

E N D
Market Situation & Outlook • Interpret market factors that impact prices and resulting marketing and management decisions • Analyze changing supply and demand factors and how they impact price • Based on economic principles and statistical analysis
Limitations • Efficient market hypothesis • All available information is quickly factored into the markets • New information and/or changes in supply and demand alter outcomes • Participants react to forecast
Market Situation • Define current and recent past • Typically measuring change in key variables to estimate change in price using historic relationships • Evaluate how current relationships differ from historic patterns
Market Outlook • Outlook on a time continuum • Long term: next growing season to multiple years • Intermediate term: within a growing season • Short term: few weeks to few months • Very short term: tomorrow to a few days to next week • Immediate: within day
Long term outlook • Buyers and sellers fully respond to changes in price and adjust quantity supplied and quantity demanded • Rely on elasticities and cost curves to estimate quantity changes • Important for policy analysis and long term investment decisions
Intermediate term outlook • Supply and demand become more inelastic • Buyers and sellers less able to react to price changes and can make limited adjustments to quantity supplied and demanded • Signals market on availability of supply
Short term outlook • Relatively inelastic supply • Sellers willing to sell at prices less than average total cost • Relatively stable demand • Prices adjust to clear supplies
Very Short Term or Immediate • More of a market timing issue • Should I take this price or wait • Non-storable commodities • Futures markets
Evaluating Source of Information • Know the source of data and analysis • Understand the motivation of the source • Public institution • Private analysis for sale • Private company confidential • What are the resources and track record
Sources of Outlook Information • USDA Data and Analysis Sources • National Agricultural Statistical Service (NASS) • Agricultural Marketing Service (AMS) • Economic Research Service (ERS) • Foreign Agricultural Service (FAS)
Sources of Outlook Information • Land Grant Universities • Long term, 10 Forecast • FAPRI 2005 U.S. and World Agricultural Outlook • Intermediate to short term • Iowa Farm Outlook (Grain, Livestock, Dairy) • Other Universities • Livestock Market Information Center
Sources of Outlook Information • Commodity organizations • Typically narrowly focused on commodity • May miss breath of outlook • Private sector market analysis firms • For profit companies that sell services • Often more short-term focused • May be associated with a trading company • In house analysis • Outlook for the company with own staff
Examples of Outlook • http://www.econ.iastate.edu/outreach/agriculture/periodicals/ifo/ • http://www.lmic.info/ • http://usda.mannlib.cornell.edu/MannUsda/homepage.do • https://www.spesend.net/speasapage.aspx?X=2R0H8E4THQM2797K00YLW1
Short to Intermediate Run Forecast • Price • = f (own supply, supply of substitutes, supply of complements, income, population, exports, imports, marketing margins) • Typically combine own supply and net trade and population into a per capita consumption variable.
Short term outlook • Use price flexibilities • The percentage change in price for a 1% change in some variable (quantity supplied) • Fpi = % Pi / % Q i • Approximately = 1/elasticity
Own price flexibilities • Assumes all else equal • Always negative • Typically about -2.0 to -3.0 for most ag commodities
Cross price flexibilities • The percentage change in the price of good i resulting from a 1% change in the quantity supplied of good j • Fpij = % Pi / % Qj • For example, what is the impact on hog prices if beef supplies are large? • Typically much smaller than own supply
Compare to another period • Compare to same time period one year earlier • Captures seasonal demand and marketing margin factors • Estimate percentage change in supply and then use flexibility to estimate percentage change in price.
Using Flexibilities Change in price of beef= % beef supply ____x -2.0 = ___ + % pork supply ____x -0.3 = ___ + % poultry supply ____x -0.3 = ___ + % income ____x +0.2 = ___ + % population ____x +1.0 = ___ Flexibilities are estimated based on historic statistical analysis. Percentage change in variables are forecast based on inventory reports and production relationships.
Forecast Supplies • Production driven and information available • USDA inventory reports • Acreage, expected yield • Marketings • Imports and exports • Trends in weights or yields • Rely on historic and biological relationships • Compare change to actual price
Forecast Supplies • USDA crop reports • Acreage • Crop progress • Carryover in storage • USDA livestock inventory reports • Cattle on feed • Hogs and Pigs • Hatchery numbers • Demand relatively stable • Population • Exports
Using Flexibilities Change in price of pork in 3rd quarter % pork supply -3.5 x -3.0 = +10.5 + % beef supply +2.5 x -0.3 = -0.75 + % poultry supply +4.0 x -0.3 = -1.2 + % income +2.0 x +0.2 = +0.4 + % population +0.9 x +1.0 = +0.9 Total expected impact on price = +9.85 This is the expected percentage change in price resulting from the supply factors considered.
Price Forecast Example for Hogs • Hog price in the third quarter one year earlier averaged $70/cwt carcass • Forecast Price = Pf = Pt-1 x (1 + % P) • $70 x (1 + 0.0985) = $76.90 • Point estimate serves as a starting point • There is an error range around the point • Try to account for other factors such as recent demand, exports, farm to retail margins, etc.
68% 16% 16% 7.06 7.06 $42.94 $50 $57.06 Forecast
Other impacts • Imports & exports • Put in perspective • Marketing margins • Seasonal patterns • Cyclical patterns
Seasonal patterns • A price pattern that repeats itself with some degree of accuracy year after year. • Supplies and demand • Often sound reasons • Widely known • Linked to storage cost or basis patterns in grains • Linked to conception and gestation in livestock
Cyclical Pattern • A production and price pattern that repeats itself over longer than a year. • Production tied to profits • Biological lag • Hogs and Cattle
Market Situation and Outlook • Economic principles and statistical analysis • Based on historic relationships and patterns • Seasonal and cyclical patterns • History is not a perfect predictor of future • Forecast errors • Efficient market hypothesis • Understand the source of data and analysis