Download
1 / 12
130 likes | 285 Views
Outline of The New Family. EMBRAER 170. 9,67M. Passengers: 70 Cruise Speed: Mach 0.8 Range: 2,100 nm Operation weight: 20700 kg. 26,00m. 29,90m. EMBRAER 175. 9,73 m. Passengers: 78 Cruise Speed: Mach 0.8 Range: 1,600 nm Operation weight: 21500 kg. 31,68m. 26,00m. EMBRAER 190.

E N D
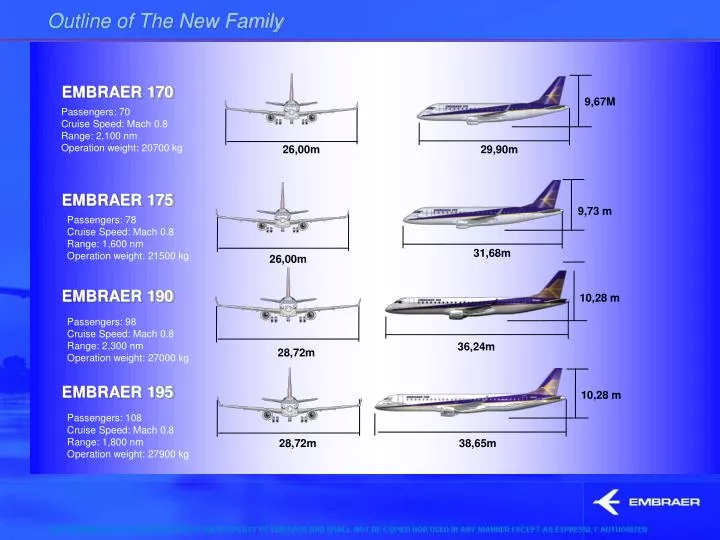
Outline of The New Family EMBRAER 170 9,67M Passengers: 70 Cruise Speed: Mach 0.8 Range: 2,100 nm Operation weight: 20700 kg 26,00m 29,90m EMBRAER 175 9,73 m Passengers: 78 Cruise Speed: Mach 0.8 Range: 1,600 nm Operation weight: 21500 kg 31,68m 26,00m EMBRAER 190 10,28 m Passengers: 98 Cruise Speed: Mach 0.8 Range: 2,300 nm Operation weight: 27000 kg 36,24m 28,72m EMBRAER 195 10,28 m Passengers: 108 Cruise Speed: Mach 0.8 Range: 1,800 nm Operation weight: 27900 kg 28,72m 38,65m
Crack Growth And Fracture Toughness Tests • Fatigue Tests: • Series of Coupon Tests Performed In Advance For The Majority of EMBRAER 170 Materials. • Different Product Thickness And Stress Ratios. • Emphasis Was Given to Al-2524-T3 (Fuselage Skin Material). • S-N Curves Adjusted According To MIL-HDBK-5 (Ch. 9) Statistical Treatment of Data. Logarithmic Equivalent Stress Fatigue Life Model Obtained For All Materials Tested. FIGURE: Example Of Curve Fitting Result For Aluminum 2000 Series.
Crack Growth And Fracture Toughness Tests FIGURE: Adjusting Equations For Ti Alloy da/dN x DK Data Crack Growth Tests: • Series of Coupon Tests Performed To Confirm Available Public Data And To Establish Material Database For DT Analysis. • Different Product Thickness And Stress Ratios. • Adjusts According To Paris, Forman, Modified Collipriest Equations + Tabular Data • K Decreasing Tests Performed To Obtain DKth Values. • Emphasis Was Given to Al-2524-T3 (Fuselage Skin Material). • Fracture Toughness Tests Also Performed For Selected Materials. FIGURE: Example of K-Decreasing Test To Obtain DKth
Design Development and Methods of Analysis Verification Test • Fatigue And DT Development Tests Performed For a Series of Typical Structural Configurations Of EMBRAER 170. • Summary Of Main Tests: Fuselage Flat Panel Crack Growth And Residual Strength Test Lap Joint And Butt Joint Fatigue Tests Floor Cross Beam Fatigue Test Fuselage Barrel Fatigue Test. Wing Panel Crack Growth And Residual Strength Test.
Design Development and Methods of Analysis Verification Test • Lap Joint And Butt Joint Fatigue Tests: • Purpose: • Lap Joint And Butt Joint Design Considerably Different From Previous EMBRAER Aircraft (EMB-120 Brasilia, ERJ-135, ERJ-145). • Verification of Suitability of Lap Joint For Some Fuselage Regions. • Validation of FEM Models • About Four Specimens Per Stress Level, Four Stress Levels • Five Configurations of Butt Joint Tested (Figure). FIGURE: Test Setup
Design Development and Methods of Analysis Verification Test FIGURE – Broken Specimens (Selected) • Lap Joint And Butt Joint Fatigue Tests: • Results: • S-N Curves For Each Configuration (Figure). • Verification of Crack Patterns For Each Configuration (Figures show cracks on the skin). BUTT JOINT 1 BUTT JOINT 2 FIGURE – S-N Curves Obtained From Tests For Specimens 04 and 05 BUTT JOINT 3
Design Development and Methods of Analysis Verification Test • Fuselage Flat Panel Crack Growth And Residual Strength Test: • Purpose: • Verification of Residual Strength for Frames, Skin and Riveting Lines. • Verification of Analysis Methods (Figure) • Verification of Crack Propagation. • Three Specimens Tested. • Strains Measured in 250 Locations. FIGURE – Detailed FEM Model of Specimen, Details With Frames And Crack Locations. FIGURE: Outline of Test Specimen And Apparatus
Design Development and Methods of Analysis Verification Test Fuselage Flat Panel Crack Growth And Residual Strength Test: FIGURE – Comparison of Analysis And Test Results – Frame Residual Strength • Results: • Comparison of Strain Values, Crack Growth Rates and Residual Strength Predictions For Various Crack Lengths (Figure). • Residual Strength Of Adjacent Frames. FIGURE – Comparison of Analysis And Test Results – Skin Crack Propagation FIGURE: Outline of Broken Panel.
Design Development and Methods of Analysis Verification Test • Wing Panel Crack Growth And Residual Strength Test: • Purpose: • Verification of Analysis Methods For Integrally Stiffened Panel. • Verification of Crack Propagation And Residual Strength For Integrally Stiffened Panel. • One Specimen Tested. FIGURE: Outline of Test Specimen And Apparatus
Design Development and Methods of Analysis Verification Test Fuselage Barrel Fatigue Test: • Purpose: • Advanced Information About Fuselage “Double-Bubble” Section Fatigue Behavior When Subjected To Pressurization Load. • Verification Of Fuselage Al-2524 Skin Material Behavior. • Different Configurations (Not Included In Aircraft) Also Tested. • 700 Strain Gages Attached In Test Article. Displacement Transducers Also Used. • Static Load Applied Prior To Fatigue Test. • Fatigue Test For Four Aircraft Design Lives (320,000 Flights). • Daily Walk Around And Scheduled Detailed Inspections Performed. • Crack Growth And Residual Strength Tests Performed For 80,000 Cycles After Fatigue Test. FIGURE: Outline of Test Article And Apparatus
Design Development and Methods of Analysis Verification Test Fuselage Barrel Fatigue Test: • Results: • Fuselage Analysis Model Verified For Pressurization Loads (Figure). • Minor Damages Found After Three Fatigue Lives (Figure). FIGURE – Detailed FEM Model of Test Article. • Conclusions: • The Test Results Supplied Important Advanced Information To Substantiate Fuselage Design. • No Design Changes Were Necessary In Aircraft Fuselage Section Structure After The Barrel Fatigue Test Was Finished. Crack FIGURE – Crack Found In Shear Clip After 3 Lives.
Full Scale Fatigue Test • EMBRAER 170 Full Scale Fatigue Test Main Objective Is To Show That The Structure Will Not Present WFD Within Two Design Lives, Complying With FAR-25.571 Requirement. • Further, The Test Will Help To: • identify Possible Fatigue Critical Locations; • Validate Crack Propagation And Residual Strength Characteristics; • Exercise Suitable Inspection Methods. • The EMBRAER 170 Full-Scale Fatigue Test Started in The First Quarter of 2003. FIGURE: Outline of Full Scale Test Article And Apparatus