Download
1 / 14
140 likes | 258 Views
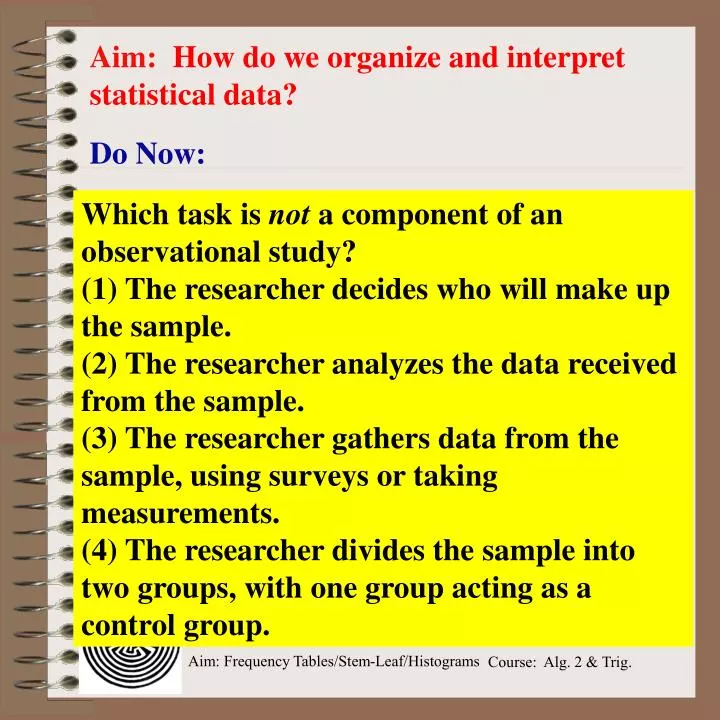
Aim: How do we organize and interpret statistical data?. Do Now:. Which task is not a component of an observational study? (1) The researcher decides who will make up the sample. (2) The researcher analyzes the data received from the sample.

E N D
Aim: How do we organize and interpret statistical data? Do Now: Which task is not a component of an observational study? (1) The researcher decides who will make up the sample. (2) The researcher analyzes the data received from the sample. (3) The researcher gathers data from the sample, using surveys or taking measurements. (4) The researcher divides the sample into two groups, with one group acting as a control group.
Recall: A teacher marked a set of 32 papers. The grades were as follows: 90, 85, 74, 86, 65, 62, 100, 95, 77, 82, 50, 83, 77, 93, 72, 98, 66, 45, 73, 100, 50, 89, 78, 70, 75, 95, 80, 78, 83, 81, 72, 75. Find the significant statistical measurements using the 1-var Stats option on the graphing calculator.
Recall: Model Problem A teacher marked a set of 32 papers. The grades were as follows: 90, 85, 74, 86, 65, 62, 100, 95, 77, 82, 50, 83, 77, 93, 72, 98, 66, 45, 73, 100, 50, 89, 78, 70, 75, 95, 80, 78, 83, 81, 72, 75. STAT EDIT 1 STAT CALC 1 ENTER
Key: 5 5 = 55 Stem-and-Leaf Plots Data - Test Scores: 90, 85, 74, 86, 65, 62, 100, 95, 77, 82, 50, 83, 77, 93, 72, 98, 66, 45, 73, 100, 50, 89, 78, 70, 75, 95, 80, 78, 83, 81, 72, 75 Stem Leaf 10 9 8 7 6 5 4 0 0 3 5 5 8 0 greatest stem to least 9 6 0 1 2 3 3 5 9 8 5 7 7 5 0 4 2 2 3 5 5 2 0 0 5 ordered leafs – lowest to highest
8 8 5 5 9 8 7 6 Key: 5 5 = 55 Stem-and-Leaf Plots Data - John’s Test Scores: 67, 82, 86, 82, 85, 84, 85, 93, 73, 82 put in order – lowest to highest 67, 73, 82, 82, 82, 84, 84, 85, 85, 93 4 3 8 4 5 8 6 2 2 2 4 4 5 3 6 7 Data - Marcia’s Test Scores: 66, 84, 86, 88, 88, 94, 95, 95, 98, 98
9 8 7 6 3 9 8 7 6 3 5 2 2 2 4 4 5 5 2 2 2 4 4 5 3 3 7 7 3rd type of graph representing data Stem-and-Leaf Plots Data - John’s Test Scores: 67, 82, 86, 82, 85, 84, 85, 93, 73, 82 67, 73, 82, 82, 82, 84, 84, 85, 85, 93 A stem-and-Leaf Plot rotated 1/4 turn counterclockwise gives us a general outline format for a histogram
Histogram/Bar Graph A histogram is a bar graph that shows the frequency of occurrence Frequency Data Results 1. Horizontal axis - data organized in intervals 2. Vertical axis - the frequency of occurrence 3. For each interval, bar drawn to height of frequency 4. No space between bars
Histogram of Paper Grades Frequency Grades Model Problem Recall our previous Paper Grade problem:
TI Graphing 2ND Y= 1 Set WINDOW GRAPH & TRACE use right and left arrows to move thru intervals.
Model Problem Frequency Grades How many students scored better than 80? How many students scored 70 or less? A cumulative histogram makes it easier to answer such questions
32 26 18 7 3 3 Cumulative Historgram Cumul at I ve Frequency 41-50 41-60 41-70 41-80 41-90 41-100 Grades How many students scored better than 80? 14 How many students scored 70 or less? 7
100% 75% 50% 25% 0% Cumulative Histogram 32 26 18 Cumulative Frequency 7 3 3 Grades Approximately what percent of students scored above 70? Approximately What percent of students scored 100 or below?
Model Problems Answer the questions below based your interpretations of the histogram. Frequency Mileage (miles per gallon) for compact cars 1) In what interval is the greatest frequency found? 2) What is the number of cars reporting mileages between 28 and 31 miles? 3) What percent of cars reported mileages from 24 to 27 miles per gallon (to the nearest %)?
Model Problem 240 students took a math test. The frequency table below shows the results. Draw a histogram representing the results. Frequency Test Scores What is the modal interval? 71-80 In what interval will you find the median? Median is average of the 120th and 121st values. Both are located in the 71 - 80 interval.