Download

1 / 21
220 likes | 346 Views
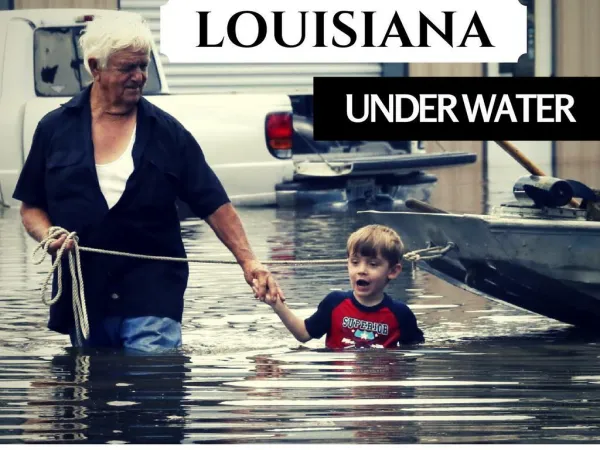
A Transition Vision for Louisiana: Clues in the Postschool Outcome Data. Dr. Lynda Price -Temple University Dr. Paul Bole -University of New Orleans Dr. Donna Wadsworth - University of Louisiana at Lafayette Dr. Keita Rone Wilson Louisiana Dept. of Education

E N D
A Transition Vision for Louisiana: Clues in the Postschool Outcome Data Dr. Lynda Price -Temple University Dr. Paul Bole -University of New Orleans Dr. Donna Wadsworth - University of Louisiana at Lafayette Dr. Keita Rone Wilson Louisiana Dept. of Education Louisiana CEC Super Conference on Special Education January 26, 2010
What is Postschool Outcome Data? • IDEA mandates that all states must file a State Performance Plan & Annual Progress Report • There are 20 Indicators under Part B—Indicators 1 (graduate with a regular diploma), 2 (drop-outs), 13, and 14 apply to transition and secondary edu • Indicator 13 (IEP postsecondary transition goals) • Indicator 14 (postschool outcomes)
Data Collection Efforts in Louisiana • How is the data Collected? Surveys are conducted at three different intervals: • High school exit • One year after high school exit • Three years after high school exit • Who Collects the Data? Transition Facilitators and local Transition Core Team Members • What is done with the Data?
Objectives of the Project: • Assist in effective collection, analysis, and dissemination of Postschool Outcome Data (with a special focus on outcomes for Indicator 14) • Explore what students with disabilities and their families are actually doing throughout the state as they transition into adulthood • Share what is used to facilitate successful self-determination, agency collaboration and transition on the local level.
Louisiana Data: Total Employed or Continuing Education • Means from overall population = 4,738 for the 2008-2009 school year • Originally reported by individual parish • Reported as a percent of the total students contacted • Parishes could vary widely, based on urban, rural, or suburban locations • Main concern: Combined employment and education
OVERALL MEANS:VARIOUS EXIT CODES • These percents are based on the total data set for 2008-2009. • Overall sample is 4, 738 students. • Four ways to exit the special education system: drop-out, graduate with a regular high school diploma, age out at 22, or earn a LA certificate • New range of school certificates also included
Disability Autism = 1.93% Blindness = 0.35% Emotional Disturbance = 6.26% Hearing Impairment = 1.58% Specific LD = 53.44% Mental Retardation = 15.46% Orthopedic Impairmt= 1.52% Other Health Impairmt = 14.05% Speech or Lang Impairmt = 1.75% Traumatic Brain Injury = 0.78% (LA PSOD 2008-2009) Gender Males = 66.1% Females = 33.39% (LA PSOD 2008-2009) Louisiana PSO DataStudents with Exceptionalities
National Statistics to Frame the Louisiana Data: • Prevalence of adults with disabilities throughout the United States by age and gender • National employment figures for adolescents and adults both with and without disabilities by gender • Poverty rates for people both with and without disabilities by age • These slides from the 2000 U.S. Census can give us clues about adult outcomes and suggest areas for further research . . . . .
Total Americans with Disabilities • PAUL INSERT NEW Figure 2 SLIDE HERE…..
Total Poverty Rates • PAUL INSERT NEW Figure 8 SLIDE HERE…..
Interviews with Stakeholders • Who? Key stakeholders (i.e., students with disabilities, their families, local schools/agencies ). • What? A series of personalized conversations about students with disabilities and Indicator 14. • Where and When? Various Louisiana Regions and parishes. Conducted on-site if possible during 2009-2010. • Why? a) To put a “face” on all of the Post-School Outcome data that is being collected about student with disabilities and make it more accessible. b) To get “in-depth” information about what is actually happening with self-determination and transition both locally and throughout Louisiana.
Notes on our Qualitative Study: • Qualitative information adds the details. It completes the picture that statistics provide about Postschool Outcomes. • There are no numbers, means, etc. • There are no“right answers”—This is each person’s individual perspective . . . So outliers are important too! • This is a “snapshot” of individual stakeholders at this point in time . . . .
Pilot Interview Examples: • Please describe what you do . . . . • What would you change about the current system for transition in your region? • Which student do you think you’ve made the most impact on their adult life? Why? • Is there anything else that you want us to know?
Future Activities:On-going Data Collection • All three Surveys (currently implemented in each Louisiana parish) • Interviews with Stakeholders (face-to-face meetings with various individuals during 2010) • Other data collection efforts as needed (ex: Transition Services Questionnaire)
Future Activities: Data Analysis • Aggregate data by various factors (i.e., age, sex, race, disability category, etc.) • Compare with data from the Picard Center • Examine interviews for themes (i.e., importance of staff training, problems tracking students, communicating with various agencies, parent concerns, etc.) • Look at how Louisiana can move from “We do this with our students . . .” to “What do we need to do next?”
Future Activities: • Focus on sharing results and information from the Louisiana State Performance plan (stressing Indicators 1, 2, 13, 14). • Framing Louisiana Postschool Outcome Data and transition/self-determination within the efforts of other geographic areas and states. • Highlighting and sharing Louisiana effective transition materials and “best practices” locally, regionally, and nationally.
For More Information • Keita Rone Wilson keita.rone@la.gov • Dr. Paul Bole pbole@uno.edu • Dr. Lynda Price pricela@hotmail.com • Dr. Donna Wadsworth dwadworth@louisiana.edu