Download
1 / 11
180 likes | 891 Views
Chapter 18 - The Financial and Economic Effect of Service. Relationship Between Service and Profits – will service improvement result in profitability? Service ? Profits Complex relationship – profitability results from service improvements are ________________________

E N D
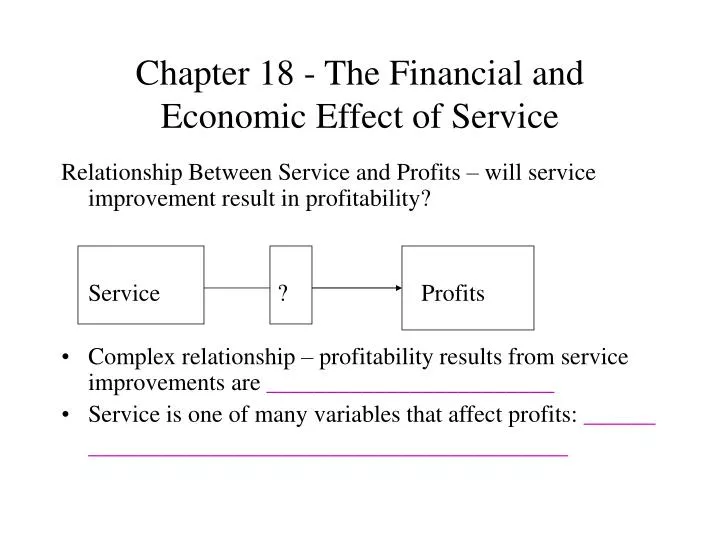
Chapter 18 - The Financial and Economic Effect of Service Relationship Between Service and Profits – will service improvement result in profitability? Service ? Profits • Complex relationship – profitability results from service improvements are ________________________ • Service is one of many variables that affect profits: ______ ________________________________________
Relationship Between Service and Profits Best strategy for improving profitability: 1. Reduce costs: focus on cost cutting and efficiencies. 2. Build revenues through improvements to customer service, customer satisfaction, and customer retention. 3. Combine (1) and (2).
Return on Service Quality (ROSQ) Return on Service Quality (ROSQ): best known and widely respected approach for making decisions about service quality investments Replaces intuition as a guide for service quality investments Intuition: ____________________________
ROSQ Assumptions: • Quality is an investment (cost) • Quality efforts are financially accountable • It is possible to spend too much on quality • Not all quality expenditures are equally valid
Offensive Marketing _________________: use of service quality to attract better and more customers to the business Effects: market share, reputation, price premium Example: There are several auto repair shops in a three block area. One of the shop owners decides to extend his operating hours until 10:00pm Monday-Thursday and provide a pick-up and delivery service, and guarantee all repairs for six months.
Offensive Marketing (Applications) Relationship between service quality and market share: • When service is good, you can charge more and still maintain or increase market share • Superior service yields higher than normal market share growth • This relationship is hard to discern because it happens over time • Advertising service excellence without sufficient service quality will not increase market share
Defensive Marketing _______________________: used by companies to prevent customer defection (“churn”) Effects of Defensive Marketing: Customer retention that leads to: • lower costs • volume of purchases • increased price premium • increased word of mouth communication
Defensive Marketing Customer Retention: In general, the longer a customer remains with the company, the more profitable the relationship is for the organization Cost of finding new customers: Provide consistently good service
Performance Measures Traditional measures of company performance: profit, sales, return on investment ______________________________: complements financial measures with operational measures of customer satisfaction, internal processes, and organization’s innovation and improvement activities ______________________________
Balanced Performance Scorecard Changes to Financial Measurement • What is the financial impact of increase or decrease in customer retention? Customer Perceptual Measures • Behavioral intentions: percentage of intent to switch, number of defections; Comment cards –
Balanced Performance Scorecard Operational Measures • Customer defined standards • Missed pickups? Innovation and Learning Perspective • Return on innovation; employee skills