Download
1 / 27
270 likes | 354 Views
Quantification of Levee Impacts on Illinois Streams. Bill Jarrett 2/9/08 Senior Geography Research Seminar Geography Club. Introduction. Two recent trends Cost of flood damage Rising flood stages. Possible explanations of rising flood stages

E N D
Quantification of Levee Impacts on Illinois Streams Bill Jarrett 2/9/08 Senior Geography Research Seminar Geography Club
Introduction • Two recent trends • Cost of flood damage • Rising flood stages • Possible explanations of rising flood stages • Conversion of wetlands to agricultural land (Pitlick 1997) • Levee constriction (Pitlick 1997, Belt Jr. 1975) • Navigation works (Belt Jr. 1975) “The status of the issue today depends entirely upon whom one asks. The concept of structural forcing of flood stages is widely cited in the environmental literature and popular press, but it is generally dismissed in the engineering and public policy arenas.” (Pinter et al. 2001)
What is a Floodplain? • Floods are naturally occurring hydrometerological events in which a river or stream rises beyond its banks onto the floodplain. • Flooding is important to the development of the floodplain, which geographically is “the flat area bordering a stream, constructed by the river in the present climate and inundated during periods of high flow.” (Leopold 1997)/ (p105)
Alteration of the Floodplain • “The purpose of a levee is to prevent flow from going into the natural floodplain. It therefore, constricts the flow and produces higher water-surface elevations as well as peak discharges” (Lewis 1998) (Haestad et al. 2003)
Hypothesis of Research • How can one measure the effects levees have on flooding? • Is there a way to determine an increase in stage per constriction in floodplain? • Engineers model what should happen-Deterministic • I’ve take empirical approach • What did happen? • Spatial question: Where are the sites show changes in flood behavior? • Historical question: When does the river change behavior?
Perspective of Study • Previous studies have been anecdotal, disparate case studies • Effect levees have on flooding is either: • Excepted- “Hey it happens.” • Or denied- “Heavy rains cause high stages.” • Either way- Never been treated as a hypothesis that has been tested on a broader scale. • Difficult to study • Floods don’t occur everyday (at least not yet!) • Need a plethora sites w/ 50 years or more of record
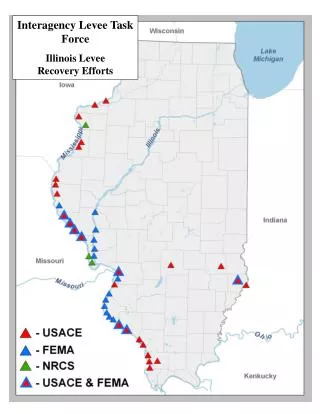
Study Area • Peakflow Data • USGS Gageing Stations record pulse along streams of varying size, shape and situation • Levees • Study sites have a broad range of floodplain constriction • Examples • Where are the levees on the map? • Nobody knows! • Corp, IL-DNR in process of creating a database of levees • Primarily used USGS 1:24,000 topographic maps to find levees
Methodology • Peakflow data plotted on an XY scatter graph • Normal • Split
Methodology • Peakflow data plotted on an XY scatter graph • Normal • Split
Methodology • Peakflow data plotted on an XY scatter graph • Normal • Split • Split are more interesting, signal some change in flood behavior. • Separate data by trend and color code. • Regression analysis run on each trend • Result- Equation in which a discharge can be input and solved for stage.
Implications • Quantification of stage increase after a levee is constructed • Becomes a model to predict stage increase based on percentage of constriction and stream magnatude
Future Research • Model to predict stage increases for any point of a stream based on discharge and constriction. • GIS project • Method to calculate and map constrictions due to levees • Summer work
GIS Final ProjectSpring 2007 • Goal: A method and map showing percent constriction of a floodplain by levees. • Study Area: Whiteside County • Illinois USGS did a pilot study to locate and digitize levees.
FIN • Questions? • Comments?
Definitions • Discharge: The volume of water passing through the channel per time. • Stage: Height of the river • Gageing Station: United States Geological Survey (USGS) operates measurement stations from which they record numerous types of data. Among them, discharge and stage. • Annual Peakflow Records: The largest discharge and resulting stage in a given year. Q=Discharge w=width(ft) d=depth(ft) v=velocity (ft/sec) Therefore, Q= w * d * v (ft3/sec= ft * ft * ft/sec)
Data Sources and Study Area • Peakflow Data: • 27,062 river gaging stations in US • 476 stations in Illinois • 108 stations have records of 50 years or more • 56 stations have not been moved. • USGS-IL Water Resources Data: • Provided gage histories, datum, location • NOAA-Nation Weather Service River Information: • Flood stage on some rivers, dates of major floods. • Illinois Geospatial Data Clearinghouse • Topographic Maps • Digital Elevation Map of Illinois
Regression Analysis • y = 2.9123Ln(x) + 614.44 • x=discharge y=stage • Discharge(flow) frequency: • Probability MUMBOJUMBO! • From Soong et al. 2004 for USGS Illinois Water Science Center • So, • Stage= 2.9123Ln(discharge) + 614.44 • The five year discharge is 8,950 cfs • Stage5= 2.9123Ln(34,200) + 614.44 • Stage5= 577.97 feet above sea level