Download
1 / 1
10 likes | 101 Views
This research differentiates deprotonated glucose-containing disaccharides using a tunable laser and FTICR mass spectrometer. Discover how wavelength-dependent fragmentation reveals unique patterns in disaccharide bonds.

E N D
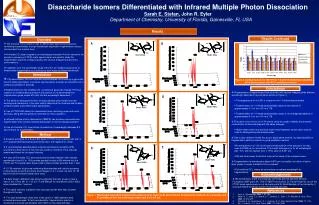
Disaccharide Isomers Differentiated with Infrared Multiple Photon Dissociation Sarah E. Stefan, John R. Eyler Department of Chemistry, University of Florida, Gainesville, FL USA Results Results Continued Overview A B • The purpose of this research was to differentiate deprotonated glucose-containing disaccharides through wavelength-dependent fragmentation using a narrow-band, line-tunable laser. • A tunable CO2 laser coupled to an electrospray ionization Fourier transform ion cyclotron resonance (FTICR) mass spectrometer was used to study the fragmentation patterns of disaccharides with various linkages and anomeric conformations. • Irradiation over the wavelength range of 9.2-9.7 µm yielded unique plots of disaccharide fragmentation as a function of both mass and laser wavelength. Glcβ1-3Glc Glcα1-3Glc Ratio Introduction • Polysaccharides, the most common carbohydrates, are joined by a glycosidic bond to lipids (glycolipids) or proteins (glycoproteins) and play an essential role in numerous activities in the body. • Disaccharides are the smallest unit containing a glycosidic linkage. Previous research on lithiated disaccharides in the positive ion mode showed that fragmentation gives unique 2D plots that are wavelength dependent. 2 • The ability to distinguish isomers of disaccharides gives insight into their bonding and interactions. It can also help tp determine the structure and location of these smaller units within larger saccharides. • Use of FTICR-MS allows for unparalleled mass resolving power and mass accuracy, along with the ability for selective ion mass isolation.3 • Infrared multiple photon dissociation (IRMPD) can produce more extensive fragmentation than collision induced dissociation for some oligosaccharides.4 • Use of a tunable CO2 laser allows for selection of wavelengths between 9.2 and 10.8 μm for fragmentation. Figure 2. Comparison of m/z 161/179 for 1-3 and 1-6 linked disaccharides. Error bars represent the 95% confidence interval. Conclusions • Fragmentation of deprotonated disaccharides with various linkages yields different wavelength-dependent fragmentation patterns (Figure 1). • The appearance of m/z 281 is unique for the 1-6 linked disaccharides. • Fragmentation of 1-3 linked disaccharides yields an abundance of approximately 1:1 for m/z 161:m/z 179. • Fragmentation of 1-4 linked disaccharides results in an average abundance of approximately 6:1 for m/z 161:m/z 179. • The ratios of m/z 161 to m/z 179 cannot solely be used to identify the anomeric conformation of disaccharides with the same linkages. • Higher laser power may produce lower mass fragments whose ratios may be used for distinguishing the disaccharides • Day-to-day variation makes this a poor quantitative method, but reproducibility of fragmentation patterns makes it a good qualitative method. • An average error of ~3% for the percent abundance of the precursor ion was seen at 9.588 µm for isomaltose. The overall average error for all wavelengths was ~6%, with the highest error (~19%) seen at 9.201 μm. • ESI and laser power fluctuation may be the cause of the variances seen. • Fragmentation at wavelengths above 9.675 µm is possible, but either a higher laser power or longer irradiation time is needed. • Conventional CO2 lasers do not produce an optimal wavelength for fragmentation. C D Glcβ1-4Glc Glcα1-4Glc Method • Analysis was done on a Bruker Bio-Apex II FTICR mass spectrometer with a 4.7T superconducting magnet and Infinity cell in the negative ion mode. • A pneumatically-assisted Apollo external electrospray ionization (ESI) source with a flow rate of 3-7 μL/min was used for ionization. Flow rate was determined based on ion signal intensity. • A Lasy-20G tunable CO2 laser producing infrared irradiation with variable wavelengths from 9.2 to 10.8 µm was passed through a KBr window into the FTICR cell. The typical laser power used in these studies was less than 1 watt. • 10-4 M solutions of glucose-containing disaccharides with various anomeric conformations (α-and β-anomers) and linkages (1-3, 1-4 and 1-6) with 10-3 M NaOH in 80:20 methanol:water were used. • A daily power calibration was done by adjusting the laser power to give a ratio of m/z 179 to 341 of 1.19 ±0.17 at 9.588 µm for isomaltose (Glcα1-6Glc) when irradiated for 1 second. • The signal intensity, irradiation time and laser power were kept constant throughout the day. • For each wavelength, three sets of ten scans of 128K datasets were collected and averaged. To test reproducibility, fragmentation spectra of isomaltose at various wavelengths were taken on two separate days. F E Glcβ1-6Glc Glcα1-6Glc Acknowledgements • We would like to thank the University of Florida and the National Science Foundation (NSF grant No. CHE-0718007) for funding, Dr. David Powell for use of the FTICR mass spectrometer in his laboratory and Dr. Brad Bendiak of the University of Colorado Health Sciences Center for providing samples. References • Varki, A. Glycobiology1993, 3, 97-130. • Polfer, N. C.; Valle, J. J.; Moore, D. T.; Oomens, J.; Eyler, J. R.; Bendiak, B. Anal. Chem. 2006, 78, 670-679. • Marshall, A. G.; Hendrickson, C. L.; Jackson, G. S. Mass Spectrom Rev1998, 17, 1-35. • Xie, Y.; Lebrilla, C. B. Anal. Chem. 2003, 75, 1590-1598. Figure 1. Wavelength-dependent fragmentation patterns for A) nigerose B) laminaribiose C) maltose D) cellobiose E) isomaltose and F) gentiobiose over the wavelength range from 9.2 to 9.7 µm.


