Download
1 / 54
540 likes | 690 Views
connection. My current lab group. David Matlaga (PhD expected 2008) Demographic and experimental comparative ecology of clonal propagules vs. seedlings of a neotropical herb Carlos Garcia-Robledo (PhD expected 2009)

E N D
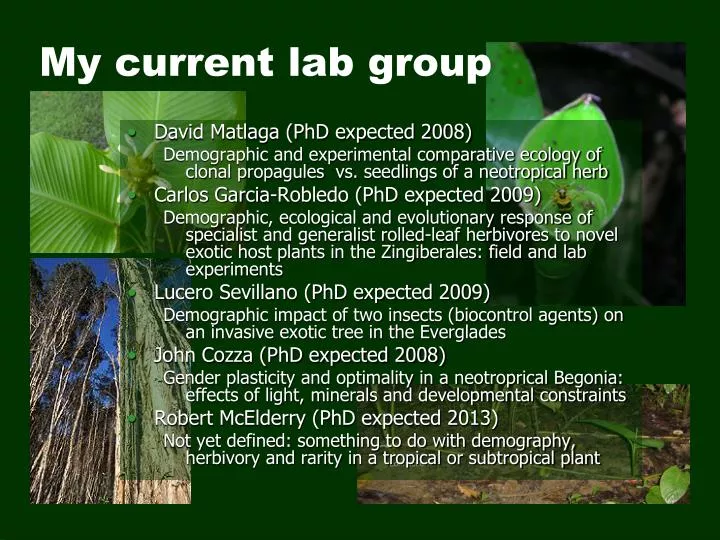
connection My current lab group • David Matlaga (PhD expected 2008) Demographic and experimental comparative ecology of clonal propagules vs. seedlings of a neotropical herb • Carlos Garcia-Robledo (PhD expected 2009) Demographic, ecological and evolutionary response of specialist and generalist rolled-leaf herbivores to novel exotic host plants in the Zingiberales: field and lab experiments • Lucero Sevillano (PhD expected 2009) Demographic impact of two insects (biocontrol agents) on an invasive exotic tree in the Everglades • John Cozza (PhD expected 2008) Gender plasticity and optimality in a neotroprical Begonia: effects of light, minerals and developmental constraints • Robert McElderry (PhD expected 2013) Not yet defined: something to do with demography, herbivory and rarity in a tropical or subtropical plant
Collaborative projects include A time to grow and a time to die: size, light, age and death of tropical trees (J. Metcalf, CH, S. Tuljapurkar) Context-dependent pollinator limitation: the future matters in a stochastically varying environment (CH and J. Ehrlen) Rate of spread of an invasive, tropical shrub (Ardisia elliptica) depends upon proportion of seeds taken by mammalian vs avian dispersers (A. Koop and CH) An integral projection model for a neotropical treelet: do pollinators matter and is there a pollinator-driven Allee effect? (S. Buzato and L. Lopes, J. Metcalf and CH) Demographic dynamics of invasive strawberry guava in Hawaii before and after introduction of a biocontrol agent (J. Denslow and CH) … and, among others, today’s talk:
A new way to integrate selection when both demography and selection gradients vary over time Carol Horvitz1, Tim Coulson2, Shripad Tuljapurkar3 ,Douglas Schemske4 1 University of Miami, Coral Gables, FL 2Imperial College, Silwood Park, London, UK 3 Stanford University, Stanford, CA 4 Michigan State University, East Lansing, MI
floral tube length and birth date How can we integrate variable selection across years? *for structured populations and overlapping generations
Preview: Integrated selection on Calathea floral tube length Environmental driver Selection El niño driven -0.071 Dry season severity -0.103 Tree-fall -0.156 Stasis -0.098 _____________________________________________
Preview: Integrated selection on red deer birth date Environmental driver Selection NAO driven -0.247 Quality correlated -0.239 IID and equal -0.287 26-yr cycle -0.289 _____________________________________________
Preview:Integrated selection • Environment-specific elasticity X • Environment-specific selection gradient • summed across all relevant life history and environmental paths Horvitz, Coulson, Tuljapurkar, Schemske (in prep)
a small tropical Mexican herb and a large Scottish mammal • Fitness components and stochastic growth rate • Selection gradients vary • Demographic transitions vary • Environmental states are dynamic • Environmental driver matters
a small tropical Mexican herb and a large Scottish mammal Birth date (seasonal advantage) 26 yrs of selection gradients Recruitment and survival for two classes Demographic projection matrices for 26 yrs Local, regional and global environmental dynamics Floral tube length (pollinator related) 3 yrs of selection gradients Fruit production Demographic projection matrices for 4 yrs Local, regional and global environmental dynamics
Phenotypic selection theory Relative fitness regressed against quantitative trait value The slope of the regression = selection gradient for the trait (Lande and Arnold 1983 Evolution) fitness something quantitative
Candidate parameters for measuring fitness • Fitness components • Reproduction (stage-specific) • Survival (stage-specific) • Growth (stage-specific) • Population growth rate
Candidate parameters for measuring fitness • Fitness components • Reproduction (stage-environment-specific) • Survival (stage-environment-specific) • Growth (stage-environment-specific) • Stochastic growth rate
Fitness component vs floral tube length (relative, mean-standardized) mature fruits Standardized selection ** ** Years => Environments Schemske and Horvitz 1989 Evolution
Fitness component vs birth date (relative, mean-standardized) Years => Environments Coulson et al. 2003 Evolution
Demographic transitions and fitness in a constant world • N(t+1) = A N(t) • A is a population projection matrix • Transitions and contributions between stages, aij = fitness components • λ = population growth rate
Demographic transitions and fitness in a variable world • N(t+1) = X(t)N(t) • X(t) is a random variable A1, A2, A3…AK ,K environments • Transitions and contributions in each environment, aijβ • λS= stochastic growth rate Tuljapurkar 1982, 1990
In a variable world : sequences, frequencies and new sensitivities • Environmental dynamics • sequences along sample paths • an expected long run stationary distribution • λs is sensitive to perturbations of means, variances, and transitions in particular environmental states • Eδ, Eμ, Eβ and others… Tuljapurkar et al. 2003 Am Nat Horvitz et al. 2005 Ecology
Environmental dynamics: Scaling up using climate data • Calathea : “Dry season ” driver • Red Deer: “NAO” driver
Sample years in context of historical record Monthly rainfall during the dry season only
Sample years in context of historical record Annual Deviations from Mean NAO 1864-2006 Monthly rainfall during the dry season only Year, starting with 1864
Hypothetical environmental drivers markov chain models El niño Dry season Tree-falls Stasis
Hypothetical environmental drivers markov chain models NAO Quality correlated IID and equal 26-yr cycle
Hypothetical environmental drivers markov chain models NAO Quality correlated IID and equal 26-yr cycle
Sequences for hypothetical environmental drivers • …2 3 4 3 3 2 2 2 4 4 3 1 3 2 2 3… El Niño • …1 3 2 1 1 1 1 3 1 3 1 3 2 1 1 1… Dry season • …3 3 3 3 3 3 3 1 4 4 2 2 3 3 3 3… Tree-falls • …1 1 2 2 2 2 2 2 3 3 3 3 3 3 3 3… Stasis
Sequences for hypothetical environmental drivers • …17 11 11 17 6 6 11 6 6 11 4 11 6 22 20… NAO • …7 15 22 10 22 3 13 3 22 21 13 2 20… Quality correlated • …2 18 19 6 2 4 1 25 3 17 4 20 10 9 4 … IID and equal • …11 12 13 14 15 16 17 18 19 20 21 22 23 … 26-yr cycle
Environment-specific elasticity of λs for each driver (to seed production) El niño Dry season Years => Environments Environment-specific Elasticity Stasis Tree-falls Stage class
Environment-specific elasticity of λs with NAO driver NAO Recruitment Environment-specific Elasticity Years => Environments Survival Age class
Environment-specific elasticity of λs for different driver… Quality correlated Recruitment Environment-specific Elasticity Years => Environments Survival Age class
Integrated elasticity • stage-specific elasticity , eij = change in λ due to a change in one element of the matrix X • selection gradient = change in one element of the matrix due to a change in the trait value (van Tienderen 2000 Ecology, Coulson et al. 2003 Evolution)
Integrated stochastic elasticityIntegrated selection • Environment-specific elasticity, eijβ= change in λS due to a change in one matrix element in one state of the environment X • selection gradient = change in one matrix element in one state of the environment due to a change in the trait value Horvitz, Coulson, Tuljapurkar, Schemske (in prep)
Calathea • Each matrix is 8x8 • 4 environments (let’s look at 1) • Selection gradient • only on top row • All reproductive stages have same value
1 example (there are 4 per driver) “dry season” driver, envt 83-84 × (elementwise multiplication) =
Red deer • Each matrix is 20 x 20 • 26 environments • environment-specific elasticity • males : zero • females : recruitment and survival each age • females are in 11 x 11 matrix, top left
1 example (there are 26 per driver) “NAO” driver, envt 5 × (elementwise multiplication) =
Integrated selection by environmental state and TOTAL El niño Total= -0.071 Dry season Total= -0.103 Years => Environments Tree-falls Total= -0.156 Stasis Total -0.098
Integrated selection by environmental state and TOTAL Quality correlated Total = -0.239 NAO Total = -0.247 Years => Environments IID and equal Total= -0.287 26-yr cycle Total = -0.289
Integrated selection by transition rate Note: These are ALL negative
Conclusions • New parameter • Integrates selection across the life cycle and across changing environments • Uses λs and its sensitivities (by environment) • The force of selection on a trait depends upon environmental dynamics • Historical climate data combined with a few years of demographic observations: plausible long run patterns
Thanks • 2006-08 NSF OPUS 1982-84, 1984-88 NSF • 1982 National Geographic • NERC • Royal Society • Biotechnology and Biological Research Council • Rum Red Deer Project • Field assistants, students and colleagues
Sample years in context of historical record Monthly rainfall during the dry season only
Monthly rainfall during the dry season only Difference from the long-term mean, Years = Environments
Sample years in context of historical record Annual Deviations from Mean NAO 1864-2006 Monthly rainfall during the dry season only Year, starting with 1864
Standardized annual deviations (observed/SD) of NAO Historical data 1864-2006
Tongue length • Floral tube length
Next slides exemplify differences due to sequence once frequency is accounted for…
Elasticity of λs to stage-specific reproduction for each environmental state, normalized for frequency Dry season El niño Years => Environments Tree-falls Stasis
Elasticity of λs to the first 3 age-specific survivals for each environmental state, normalized for frequency Quality correlated NAO 26 yr Cycle Iid and equal Years => Environments