Download
1 / 6
60 likes | 209 Views
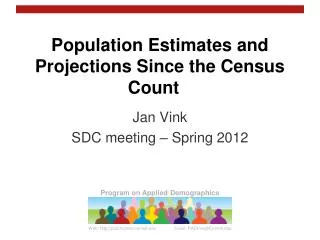
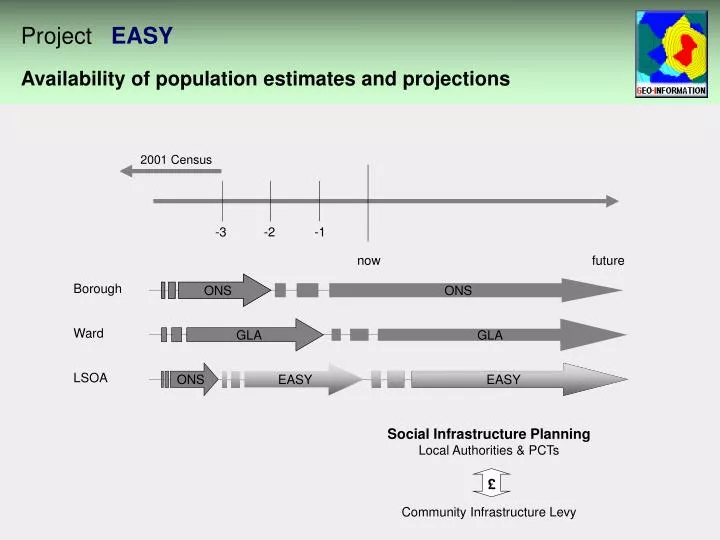
-3. -2. -1. now. future. Project EASY. Availability of population estimates and projections. 2001 Census. ONS. Borough. ONS. GLA. GLA. Ward. ONS. EASY. EASY. LSOA. Social Infrastructure Planning Local Authorities & PCTs Community Infrastructure Levy. £. Project EASY.

E N D
-3 -2 -1 now future Project EASY Availability of population estimates and projections 2001 Census ONS Borough ONS GLA GLA Ward ONS EASY EASY LSOA Social Infrastructure Planning Local Authorities & PCTs Community Infrastructure Levy £
Project EASY Question for discussion How important is population estimation to you? What is your view?
Project EASY Census Digitally available 1971 1981 1991 2001 ....... Changes in administrative boundaries Changes in reporting geography Changes in questions Value not just in population count Issues of accuracy and consistency over time
Project EASY ONS small area population estimates • Mid-year estimates at Local Authority and LSOA • For LSOA estimates, data sets used are: • NHS patient register • Child benefit • Older persons dataset • Special populations: • Prisoners • UK armed forces • Foreign armed forces and dependents • Constrained to Local Authority MYE • The first three data sets are used to calculate • change ratios for quinary are groups and gender • which are then applied to the previous year’s • estimate. • Key assumption is that the relationship between • these data sets and the true population remains • the same for all years at small area geographies.
Project EASY GLA 2007 round demographic projections • Mid-year estimates at Local Authority and Ward • Change analysis 2001-2006 based on ONS MYE • Future fertility rates and gender/age-specific survival rates based on ONS 2006 MYE • Main determinant of population distribution is the 2004 London Housing Capacity Study and DCLG 2004-based household projections • Inputs are: • Base population • Fertility • Mortality/survival • 2001-02 migration matrix • 2001 migration flow age structures • 2002-03, 2005-06, 2006-07 gross inflows and net flows • Development data • 2004 household representative rates
Project EASY Our criteria In order to develop useful population estimates, we adopted the following criteria: • Locally accessed data sets • Up-to-the-moment estimates • Small geographical areas (LSOA) • Can be carried out locally by analysts • Good quality data Model-based rather than counts-based Key starting point: dwelling stock by Council Tax bands