Download
1 / 44
440 likes | 564 Views
A photon sample selection from Z ll decay. Alexey Antonov * , Evgeny Yu Soldatov * * Moscow Engineering Physics Institute (MEPHI). “Physics&Computing in ATLAS” – 22/09/2010. Outline:. Motivation True level Signal Background Reconstruction level control plots

E N D
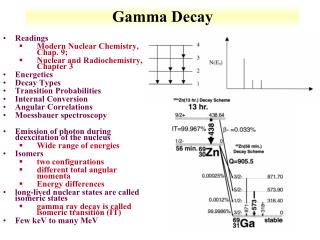
A photon sample selection from Zlldecay Alexey Antonov*, Evgeny Yu Soldatov* *Moscow Engineering Physics Institute (MEPHI) “Physics&Computing in ATLAS” – 22/09/2010 Outline: • Motivation • True level Signal Background • Reconstruction level control plots • Reconstruction Signal/Background optimization • Results for Z -> ee • Results for Z -> • Conclusions Pure photon sample selection
Photon sample selection using Z->llprocess Truth M(Z->ee) Idea is to obtain pure photon sample from known physics process with distinctive kinematical feature - -M(ee) and dR(e) -M() and dR() Signal Background -FSR -ISR -Brem -Jets One of a problems is a small production cross section. M(ee) [GeV] Main goal of the analysis is to find the signal selection method - check Signal to Background ratio - and statistical yield Pure photon sample selection
MC sample and preselection -1 Public FullSim MC samples - 5M events ~4.5 fb Z -> ee mc08.106050.PythiaZee_1Lepton.recon.AOD.e347_s462_r541_tid028253 Z -> mc08.106051.PythiaZmumu_1Lepton.merge.AOD.e347_a84_t53_tid061356 Et() > 5 GeV; Pt() > 15 GeV; Pt(e) > 15 GeV; |()| < 2.5; |(e)| < 2.5; Public Analysis code rel. 15.6.1 Pure photon sample selection
Z -> eesignal and backgrounds (truth level) Pure photon sample selection 4
R distribution for signal and all backgrounds (TRUTH) Signal (FSR) ISR Jets treated as Brem -to-closest lepton angle Pure photon sample selection 5
R cut selection Remaining statistics & efficiency of photon reconstruction vs. R cut. FSREfficiency Remaining signal statistics vs. R cut R>0.2 always used further R>0.2 R Pure photon sample selection 6
TRUTH invM(ee) for FSR, ISR and Jets (as photon) Jets ISR FSR M(ee) [GeV] M(ee) [GeV] M(ee) [GeV] ISR Jets FSR 148K events 0.9K events 52K events M(ee) [GeV] M(ee) [GeV] M(ee) [GeV] For bottom plots 80GeV <invM(ee) < 100GeV Pure photon sample selection
Z -> eeReconstruction level Pure photon sample selection 8
Control plots for reconstructed FSR photons (signal) Et() distribution Efficiency vs. Et () - no tight cut - with tight cut ET (), MeV ET (), MeV () distribution Efficiency vs. () Pure photon sample selection 9
Reconstructed invM(ee) FSR – 26k - No Tight cut all Z->eeevents - Tight cut Signal/Background - No Tight cut - No Tight cut - Tight cut - Tight cut M(ee) [GeV] Bkg. - No Tight cut M(ee) [GeV] - Tight cut M(ee) [GeV] M(ee) [GeV] Optimal M((ee) window is 82<M(ee)<95 GeV (see backup slides) Pure photon sample selection
ee selection optimization Usual selection: Mass window 82<M(ee)<95 GeV window Photon tight cut Extra cuts: Mass window for invariant M(ee); Photon ET cut; Upper Rcut. All these cuts will be applied sequentially to the signal with initial statistics 26139 events. Pure photon sample selection
ee mass selection optimization Pure photon sample selection
Reconstructed invM M(ee) - 82<M(ee)<95GeV window Signal/Background FSR Bkg. 11.4k events 21.1k No tight CUT Max s/b ~ 3.3 M(ee) [MeV] M(ee) [MeV] M(ee) [MeV] Signal/Background Bkg. FSR 3.9k events 15.8k Tight CUT Max s/b ~ 7 M(ee) [MeV] M(ee) [MeV] M(ee) [MeV] Pure photon sample selection
Reconstructed invM(ee) @ 82<M(ee)<95 GeV &50<M(ee)<82 GeV Bkg. FSR NO Tight cut <S/B>~2.75 6.1k events 16.7k events M(ee) [MeV] M(ee) [MeV] Bkg. FSR Tight cut <S/B>~6.2 12.7k events 2.k events M(ee) [MeV] M(ee) [MeV] - 96% of background rejected if M(ee)and M(ee)windowcuts applied - 50% signal reduction (with tight cut) Pure photon sample selection
Upper R cut(Tight and Mee cuts applied) Remaining signal statistics and averaged s/b ratio (integral from 0.2 to upper R cut) as a function of the upper R cutwith Mee and tight cut. Remaining statistics S/B ratio DR DR With the cut R<1.6 the S/B ratio reaches level of 7.47 with remaining statistics 39% of the initial one. Pure photon sample selection 15
Effect of the low Et cut for photons (all previous cuts applied) Remaining statistics From ET distribution, it is clear, that low ET cut can give an effect - Signal - Background ET, MeV S/B ratio ET, MeV ET, MeV For ET>9 GeV averaged S/B=10.45 can be achieved and statistics is 31% from the initial one. Pure photon sample selection 16
Differential distributions of s/b ratio as a function of InvMee for all previously presented cuts and with addition of the tight cut Ratio of S/B for selection w/o TightCut to selection with TightCut S/B ratio - all presented cuts - extra tight cut Mee, MeV For black line averaged S/B=7.18 and remaining statistics is 39% from the initial one. For green – it was given on the previous slide (10.45 and 31% accordingly). Z->ee could be useful for the tight cut efficiency validation Pure photon sample selection 17
Selection S/B ratio Statistics from initial Number of signal events No cuts 0.18 100% 26139 Inv Mee<95 GeV 1.40 89% 23221 + Inv Mee>82 GeV 1.87 82% 21499 + Tight cut 4.22 62% 16112 + Inv Mee<82 GeV 5.58 53% 13770 + Inv Mee>50 GeV 6.19 50% 13004 + R<1.6 7.47 39% 10318 + ET>9 GeV 10.45 31% 8187 Z ->eeSelections Summary Pure photon sample selection 18
Z -> Reconstruction level Pure photon sample selection 19
Reconstructed invM() @ 80<M()<96 GeV & 15<M()<80 GeV Same R>0.2 used Bkg. FSR <S/B>~11.9 NO Tight cut 1348 events 16k.events M() [MeV] M() [MeV] Bkg. FSR Tight cut <S/B>~11.6 15k.events 1290 events M() [MeV] M() [MeV] - 99% of background rejected if M() and M() cuts applied - 30% signal reduction - Tight cut has marginal effect on selection if M() and M() cuts applied Pure photon sample selection
Differential Signal to Background Ratio as a function of invM() 80<M()<96 GeV & 15<M()<80 GeV <S/B>~11.9 <S/B>~11.6 No TightCut/TightCut Ratio NO Tight cut Tight cut M()[MeV] M()[MeV] Tight cut has a marginal effect on selection if M() and M() cuts applied Z-> could be useful for the tight cut efficiency validation. Pure photon sample selection
Low Et() selection @ 80<M()<96 GeV & 15<M()<80 GeV Statistics reduction -Signal (FSR) - All Background ET () MeV Integral S / B ET () MeV For Et() >10 GeV; => <S/B>~25; Cost – 15% of signal events and Et() range ET () MeV Pure photon sample selection
Z -> selections Summary -1 Public FullSim MC sample of Z -> - 5M events ~4.5 fb Pure photon sample selection
About real data (I) After all Z-boson note (ATL-COM-PHYS-2010-701) cuts for 310 nb-1 (runs 161520-161948) we have: Pure photon sample selection
About real data (II) Probability of considering process is ~0.5% of Z decays to two leptons. (For previous slide picture – 0 such events). Expecting integral luminosity this year: ~60 pb-1 ~20k of Z (~100 our photons); Expecting luminosity next year: ~1 fb-1 ~1M of Z (~5000 our photons). So in the end of this year there will be necessary statistics for start of the analysis such process. But good analysis and good photon sample to obtain (there will be losses of statistics due to cuts) will be possible in the next year. Pure photon sample selection
Conclusions -Selection of a pure photons in the process Z -> ee & Z -> has been studied using 5M (~4.5 fb ) events MC samples. -1 • Tight cut allows to identify 62% of photons with the signal-to-background ratio of 4.2 (ee) and 6.7() in the invariant mass range 82-95 GeV. - Z -> ee : set of cuts 82<M(ee)<95 GeV &50<M(ee)<82 GeV &Et() >9 GeV & 0.2<R<1.6 provides ~8200 photons with purity ~90% - Z -> : set of cuts 80<M(ee)<96 GeV &15<M(ee)<82 GeV &Et() >10 GeV & 0.2<R provides ~13600 photons with purity ~96% • Tight cut has a marginal effect on selectionif M() and M() applied. • Means that Tight cut can be studied using Z -> . -1 • All in all, about ~22k pure photons from ~4.5 fb can be selected using • Z boson decays to electrons and muons using proposed method. • Analysis of the real data statistics has been done. Pure photon sample selection
Backup slides Pure photon sample selection 27
Resolution of reconstructed invM(ee), FSR only Pure photon sample selection 28
ETanddistributions for reconstructed ISR photons (background) matched with truth and reconstruction efficiency ET Efficiency • without tight cut • - with tight cut ET, MeV ET, MeV Efficiency Pure photon sample selection 29
A choice of the mass window for Zeeg- decay study (I) Here presented the remaining signal statistics and averaged s/b ratio (integral from 0 to Mee limit) as a function of the upper Mee limit. Remaining statistics S/B ratio Mee, MeV Mee, MeV With the cut Mee<95 GeV averaged S/B=1.4 and statistics is 89% of the initial one. Pure photon sample selection 30
A choice of the mass window for Zeeg- decay study (II) Here presented the remaining signal statistics and averaged s/b ratio (integral from bottom Mee limitto 95 GeV) as a function of bottom Mee limit. Remaining statistics S/B ratio Mee, MeV Mee, MeV Further interval mass 82< Mee<95 GeV, with averaged S/B=1.87 will be used for analysis (statistics is 82% of the initial one). Pure photon sample selection 31
Differential distributions of s/b ratio as a function of InvMee for InvMee S/B ratio • with tight cut • - without tight cut Mee, MeV With the tight cut averaged S/B ratio in the chosen mass window is 4.22. Remaining statistics is 62% of initial. Pure photon sample selection 32
Bottom cut for theInvariant Mass of two electrons. Upper cut is 82 GeV (additional to the tight cut) Here presented the remaining signal statistics and averaged s/b ratio (integral from bottom Mee limitto 82 GeV) as a function of bottom Mee limit. Remaining statistics S/B ratio Mee, MeV Mee, MeV For the cut Mee>50 GeV averaged S/B=6.19 and remaining statistics is 50% from the initial one. Pure photon sample selection 33
Differential distributions of s/b ratio as a function of InvMee for 50<InvMee<82 cut only and with addition of the tight cut S/B ratio • with 50<InvMee<82 cut only • with tight cut addition Mee, MeV For black line averaged S/B=2.75 and remaining statistics is 65% from the initial one. For green – it was given on the previous slide (6.19 and 50% accordingly). Pure photon sample selection 34
Comparison of the s/b ratio for tight cut only with the s/b ratio for 50<InvMee<82 cut only S/B ratio InvMee cut / Tight cut • Tight cut - Mee cut Mee, MeV Mee, MeV It could be useful for the tight cut efficiency validation. Pure photon sample selection 35
Differential distributions of s/b ratio as a function of InvMee for 50<InvMee<82 and DR<1.6 cuts and with addition of the tight cut S/B ratio • with 50<InvMee<82 and DR<1.6 cuts- with tight cut addition Mee, MeV For black line averaged S/B=3.98 and remaining statistics is 51% from the initial one. For green – it was given on the previous slide (7.47 and 39% accordingly). Pure photon sample selection 36
Comparison of the s/b ratio for tight cut onlywith the s/b ratio for 50<InvMee<82 and R<1.6 cuts only S/B ratio InvMee&Rup cuts / Tight cut • tight cut only • - InvMee&Rup cuts only Mee, MeV Mee, MeV It could be useful for the tight cut efficiency validation. Pure photon sample selection 37
ET anddistribution of the truth and reconstructed (in photon container) jets and efficiency of such reconstruction Reco Jets Truth Jets Efficiency ET, MeV ET, MeV ET, MeV Reco Jets Truth Jets Efficiency Pure photon sample selection 38
Truth signal, background and ratio of s/b ratio as a function of invariant mass ee in full area and in window FSR - Signal Truth Jets Truth S/B ratio Mee, MeV Mee, MeV Mee, MeV Mee, MeV Mee, MeV Mee, MeV Pure photon sample selection 39
ET and distributions of all reconstructed photons (with and without tight cut) ET ET, MeV ET With tight cut With tight cut ET, MeV The peak in ET distributions around half Z-boson mass corresponds to an error in the reconstruction of the conversion photon from one of the Z-boson’s electron. Pure photon sample selection 40
Backup slides Z -> Pure photon sample selection 41
R distributions for signal and background (TRUTH) Signal (FSR) ISR R R Jets treated as Brem R R -to-closest lepton angle Pure photon sample selection
Resolution of reconstructed M() Pure photon sample selection
Control plots for reconstruction - Z -> FSR photons reconstruction Et() distribution Efficiency vs Et() Tight Cut Et() [MeV] Et() [MeV] ()distribution Efficiency vs () () () Pure photon sample selection