Download
1 / 38
380 likes | 528 Views
Equity & Efficiency in South African Primary Schools A Preliminary Analysis of SACMEQ III South Africa. IPSU - Session 8 Stellenbosch University. Aims for today. Lucky you!!. Give background to SA education system What are major fault-lines in our education system?

E N D
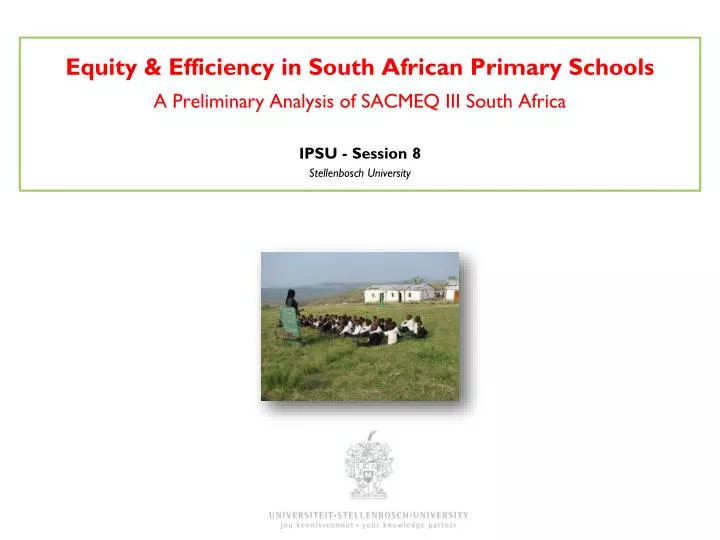
Equity & Efficiency in South African Primary SchoolsA Preliminary Analysis of SACMEQ III South Africa IPSU - Session 8 Stellenbosch University
Aims for today Lucky you!! • Give background to SA education system • What are major fault-lines in our education system? • What is extent of underperformance of SA school system? (Regionally & Internationally) • What factors drive underperformance of SA school system?
Social Security in SA 2 main components: • Occupational (social) insurance • Retirement benefits, some unemployment insurance, medical benefits (for the better skilled) • Only 40% of the labour force is covered due to high unemployment • Social assistance (13.3%) • Child Support Grant (CSG) R260/month • Means test {cannot earn > R2600/month) • Old Age Pension (OAP) R1140/month • {cannot earn > R3740/month) • Disability Grant (DG) R1140/month • {cannot earn > R3740/month) • {Foster Child Grant R740/month} Targeting?? Means testing? BIG?
SA’s dualistic school system and labour market Highquality schools • ±10% of schools, mainly ex-white, but racial composition changed • Produce strong cognitive skills • Teachers well qualified, schools function well, good assessment, parents involved • Some talented, motivated or lucky students manage the transition • Big demand for good schools, despite fees • A few schools cross the divide • Vocational training • Affirmative action Low productivity jobs & incomes • Often manual or low skill jobs • Limited or low quality education • Minimum wage can exceed their productivity Low quality schools • Produce very weak cognitive skills • Teachers less qualified, de-motiva-ted, many schools dysfunctional, weak assessment, little parental involvement, strong union presence • Mainly former black (DET) schools High productivity jobs & incomes ±10% of labour force – mainly professional, managerial & skilled jobs Requires graduates, good quality matric, or good vocationalskills Historically mainly whites
School’s in SA Public schools
From: South African Child Gauge 2008/9 Available www.ci.org.za
% below low international benchmark (400) in PIRLS 2006 (Gr.4; in SA Gr.5)
% of SA students exceeding performance at 75th percentile of developed countries(“who would ‘make it’ economically in developed countries")
Objections to international comparison: • It’s wrong to compare SA to OECD countries • SA is still recovering from apartheid • SA is underperforming due to poverty
SACMEQ data 1 – 2 – 3 – 4 – 5 • Southern and East AfricanConsortium forMonitoringEducationalQuality • Research capacity & technical skills of educational planners • Conditions of schooling and quality of education • Grade 6 (13 yrs) • SACMEQ II (SA) - 2000 • Schools (169) Teachers (322) Students (3163) • SACMEQ III (SA) - 2007 • Schools (392) Teachers (1163) Students (9083) • Literacy Test – 55 MCQ • Numeracy Test – 49 MCQ • HIV/AIDSKnowledge test – 86 T/F • Demographic / Home background / Schooling - 64 Questions
SA in regional context? R - 10th/15 M – 8th/15
Performance low AND unequal 14th/15 4th/15 NER?
Placing SA in regional context Rural 13th /15
Placing SA in regional context Urban 9th /15
3) Not only does SA’s school system perform poorly, it is also highly unequal
SA in regional context WCA LIM
1 – 2 – 3 – 4 – 5 Viva Mzansi 40.2% 27.2% Grade 6 13 years olds Complete and utter disgrace – government failure on a national scale Wholesale failure of the government to provide the most basic tool needed for mobility, or even dignified living.
Primary school: PIRLS (Gr 5) reading scores by school type NB correlation between race and wealth
Through-put – racial disparities Proportion of 16-17 years-olds who have completed Grade 9 Source: General Household Survey 2009; own analysis
1 – 2 – 3 – 4 – 5 Multivariate analysis • svyregressions • Stratification (Province) • Clustering (School) • Education production function approach • Explaining variation in Numeracy and Literacy • Sample selection issues around ‘teacher test-score’ • Reading – of 498, 83 (17%) did not write • Maths – of 498, 97 (20%) did not write • Run regressions with & without teacher test-score variable • (Not shown here) • Opportunity we can’t pass up
Results? Within policy control • Frequency of English spoken at home • Caveat – SACMEQ III tests conducted in English/Afrikaans (LOLT?) • Socioeconomic Status (SES) • MCA 31 possession questions • Non-linear – wealth has a greater effect at high levels of wealth • SSES > SES • SSES • Preschool education • Frequency of grade repetition • Frequency of homework • +++ Once/Twice per week or ‘most days’ • Reading Textbook availability { +- Mean 510 ; SD 100 }
1 – 2 – 3 – 4 – 5 Results (cont.) Teacher knowledge? Intuition? Common sense? Binding constraints
1 – 2 – 3 – 4 – 5 Concluding points Specifically • Provide a more nuanced picture of national/provincial performance • Identified 5 correlates with math/reading performance • Frequency of English spoken at home • SES & SSES • Preschool education • Grade repetition • Homework • Reading textbook • Surprisingly low impact of teacher knowledge (?) More research needed. More generally: • Confirming previous studies: SA’s performance is disgracefully poor and highly unequal • If this data is legitimate (and we think it is – c.f. ANA’s) why aren’t people striking?!