Download
1 / 17
170 likes | 264 Views
The Continuing Erosion of Health Benefits Among Workers with Low Wages. Sara R. Collins, Ph.D. The Commonwealth Fund National Academy of Social Insurance Roundtable on The Growing Inequality in Workers’ Health Benefits January 28, 2005.

E N D
The Continuing Erosion of Health Benefits Among Workers with Low Wages Sara R. Collins, Ph.D. The Commonwealth Fund National Academy of Social Insurance Roundtable on The Growing Inequality in Workers’ Health Benefits January 28, 2005
Growth in Job-Based Premiums Compared to Earnings Growth Percent change from previous year 3% 2% Source: J. Gabel, et al. “Health Benefits in 2004: Four Years of Double-Digit Premium Increases Take Their Toll on Coverage,” Health Affairs, Sept/Oct 2004.
Deductibles Rise Sharply, Especially in Small Firms, Over 2000-2004 PPO in-network and out-of-network deductibles In-network Out-network In-network Out-network Large Firms, 200+ Employees Small Firms, 3-199 Employees Source: J. Gabel and J. Pickreign, Risky Business: When Mom and Pop Buy Health Insurance for Their Employees (New York: The Commonwealth Fund, April 2004); KFF/HRET Employer Health Benefits 2004 Annual Survey.
Working Adults with Health Benefits from Own Employer, By Income, 1987-2003 Percent of Workers with Health Benefits from Own Employer Source: Analysis of the March 2004 Current Population Survey by Danielle Ferry, Columbia University, for the Commonwealth Fund.
Working Adults with Own ESI or Any Private Coverage by Income Quintile, 2003 Percent of workers age 19-64 *Includes ESI any source and private individual coverage Source: Analysis of the March 2004 Current Population Survey by Danielle Ferry, Columbia University, for the Commonwealth Fund.
Working Adults Who Are Uninsured, By Income Quintile, 1987-2003 Percent of Workers Uninsured *In 1999, CPS added a follow-up verification question for health coverage. Source: Analysis of the March 2004 Current Population Survey by Danielle Ferry, Columbia University, for the Commonwealth Fund. .
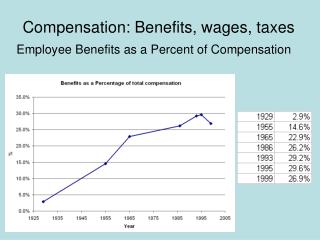
Job Compensation in the American Workforce Undesignated Wage Rate 8% Higher Compensated: Wage $15/hr or more and ESI 37% Lowest Compensated: Wage less than $10/hr 26% Wage $10–15/hr 24% Wage $15 or more but no ESI 5% Mid-Compensated: 29% Note: ESI defined as employer-sponsored insurance. Source: S.R. Collins et al., Wages, Health Benefits, and Workers’ Health, The Commonwealth Fund, October 2004.
Paid Sick Leave by Workers’ Job Compensation Levels Percent Note: Lowest compensated are all workers with wage rate <$10/hr; mid-compensated are workers with wage rate $10–15/hr and those with $15/hr or more but no employer-sponsored insurance; higher compensated are workers with wage rate $15/hr or more and have employer-sponsored insurance. **Differences by compensation group statistically significant at p<.01. Source: The Commonwealth Fund Biennial Health Insurance Survey (2003).
Percent of Workers with Health Problems by Job Compensation Level Percent Note: Lowest compensated are all workers with wage rate <$10/hr; mid-compensated are workers with wage rate $10–15/hr and those with $15/hr or more but no employer-sponsored insurance; higher compensated are workers with wage rate $15/hr or more and have employer-sponsored insurance. **Differences by compensation group statistically significant at p<.01. +Either fair or poor health, disability, or one of four chronic conditions: heart disease, cancer, diabetes, arthritis Source: S.R. Collins, et al., Wages, Health Benefits, and Workers’ Health, The Commonwealth Fund, October 2004.
Preventive and Primary Care Varies by Workers’ Job Compensation Levels Percent Note: Lowest compensated are all workers with wage rate <$10/hr; mid-compensated are workers with wage rate $10–15/hr and those with $15/hr or more but no employer-sponsored insurance; higher compensated are workers with wage rate $15/hr or more and have employer-sponsored insurance. Source: S.R. Collins et al., Wages, Health Benefits and Workers’ Health, The Commonwealth Fund, October 2004.
Women’s Preventive Care Varies by Workers’ Job Compensation Levels Percent Note: Lowest compensated are all workers with wage rate <$10/hr; mid-compensated are workers with wage rate $10–15/hr and those with $15/hr or more but no employer-sponsored insurance; higher compensated are workers with wage rate $15/hr or more and have employer-sponsored insurance. * Pap test for women ages 19–29 in past year and for women ages 30–64 in past three years ^ Mammogram for women ages 50–64 in past two years Source: S.R. Collins, et al., Wages, Health Benefits, and Workers’ Health, The Commonwealth Fund, October 2004.
Low and Mid-Range Compensated Workers Are Most Likely to Report Access Problems Percent reporting the following problems due to cost: Note: Lowest compensated are all workers with wage rate <$10/hr; mid-compensated are workers with wage rate $10–15/hr and those with $15/hr or more but no employer-sponsored insurance; higher compensated are workers with wage rate $15/hr or more and have employer-sponsored insurance. Source: S.R. Collins, et al., Wages, Health Benefits, and Workers’ Health, The Commonwealth Fund, October 2004.
Lowest and Mid-Range Compensated Workers More Likely to Spend Large Shares of Income on Out-of-Pocket Medical Costs Percent Note: Lowest compensated are all workers with wage rate <$10/hr; mid-compensated are workers with wage rate $10–15/hr and those with $15/hr or more but no employer-sponsored insurance; higher compensated are workers with wage rate $15/hr or more and have employer-sponsored insurance. **Differences by compensation group statistically significant at p<.01. Source: S.R. Collins, et al., Wages, Health Benefits, and Workers’ Health, The Commonwealth Fund, October 2004.
Low and Mid-Range Compensated Workers Are Most Likely to Report Problems Paying Medical Bills Percent who had the following problems in past year: Note: Lowest compensated are all workers with wage rate <$10/hr; mid-compensated are workers with wage rate $10–15/hr and those with $15/hr or more but no employer-sponsored insurance; higher compensated are workers with wage rate $15/hr or more and have employer-sponsored insurance. Source: S.R. Collins, et al., Wages, Health Benefits, and Workers’ Health, The Commonwealth Fund, October 2004.
Policy Implications • Employment linked to health care access, protection from catastrophic medical costs, ability to take sick leave • Employer-based insurance system alone insufficient to provide coverage to all Americans • Current structure of system unlikely to change in near future: • Strong public support • Relative efficiency in financing coverage • Federal fiscal constraints • Coverage expansions will likely need to build on structure of current system • Creating Consensus • Proposals of 2004 election cycle • Policy options to insure more equitable health insurance coverage should remain on policy agenda
Commonwealth Fund Biennial Health Insurance Survey (2003) • Random nationally representative sample of adults 19 and older living in continental U.S. • Over-sampling of low income, African American, and Hispanic households • 4,052 adults age 19 and older • Worker sample: 1,963 part-time and full-time workers, not self-employed, ages 19-64; representing about 107 million workers. • 25-minute telephone interview conducted by PSRA International: • September 3, 2003 through January 4, 2004 (2003) • Results weighted to correct for disproportionate sample design and to make sample representative of adults living in the U.S. • Response rate: 50%
Acknowledgments Karen Davis, President, The Commonwealth Fund, S.R. Collins, K. Davis, M.M. Doty, A. Ho, Wages, Health Benefits, and Workers’ Health, The Commonwealth Fund, October 2004. Cathy Schoen, Vice President, The Commonwealth Fund Michelle M. Doty, Senior Analyst, The Commonwealth Fund, S.R. Collins, K. Davis, M.M. Doty, A. Ho, Wages, Health Benefits, and Workers’ Health, The Commonwealth Fund, October 2004. Alice Ho, Research Associate, The Commonwealth Fund, S.R. Collins, K. Davis, M.M. Doty, A. Ho, Wages, Health Benefits, and Workers’ Health, The Commonwealth Fund, October 2004. Visit the Fund at: www.cmwf.org