Download
1 / 35
350 likes | 537 Views
ICAR – ICRISAT Collaborative Project Tracking Change in Rural Poverty in Household and Village Economies in Eastern India (Sponsored by Bill and Melinda Gates Foundation). Rural household scenario in Bihar: Some empirical evidences. R. K. P. Singh, K. M. Singh and Abhay Kumar. Bihar Agriculture.

E N D
ICAR – ICRISAT Collaborative ProjectTracking Change in Rural Poverty in Household andVillage Economies in Eastern India(Sponsored by Bill and Melinda Gates Foundation) Rural household scenario in Bihar: Some empirical evidences R. K. P. Singh, K. M. Singh and Abhay Kumar
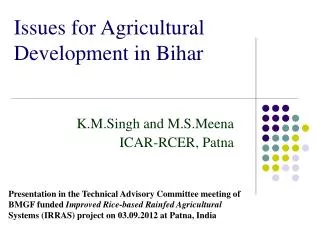
Bihar Agriculture • Bihar, third largest state with respect to population and seventh in terms of area. • Bihar supports 8.8 percent population of the country with only 2.8 per cent of land mass. • Agriculture is an important sector as it contributes about 20 per cent to State Gross Domestic Product and provides employment to 70 per cent of rural working force. • State is characterized by marginal & small land holders. • More than 90 % farm households are marginal with less than 1 ha land but own about 44% of cultivated land.
Bihar Agriculture • Agriculture sector experienced a drastic change with respect to public investment, use of inputs, extension activities and crop-milk-fish production in recent years. • State government funding to agriculture increased from less than Rs 200 crore during 2005-06 to more than Rs 2000 crore during 2012-13 • State Agricultural GDP was almost stagnant at Rs 32.5 billion during 1981-94 and its growth was negative in Ninth Five Year Plan (-1.4%) which turned positive in Tenth Five Year Plan (0.91%) and increased to 5.9% in Eleventh five year plan.
Bihar Agriculture • State agriculture sector achieved spectacular growth in 2006-07 (27.50%), 2008-09 (11.71%), and 2011-12 (17.16%). • Despite scanty rainfall in south Bihar, the state recorded the food grain production of 178 lakh tonnes and milk production of 65 lakh tonnes in 2011-12, indicating sustainability in agricultural production. • About 69 per cent of geographical area is under cultivation but more than one- third of geographical area faces various problems.
NHM, Subsidy on farm well/pond/ agricultural machinery/ Diesel, Shree Vidhi, NFSM
Old age pension, Widow pension, Pension for Physically Handicapped