Download
1 / 39
390 likes | 578 Views
HIV/AIDS Epidemic Update July 2010. San Francisco Area AIDS Education and Training Center University of California, San Francisco Department of Family and Community Medicine at San Francisco General Hospital. Notice to Users.

E N D
HIV/AIDS Epidemic UpdateJuly 2010 San Francisco Area AIDS Education and Training Center University of California, San Francisco Department of Family and Community Medicineat San Francisco General Hospital
Notice to Users • These materials are provided solely as an educational resource to the AETC community and its constituents; and are intended for use by experienced AETC trainers, clinical faculty, training participants, and technical assistance recipients. • Users are cautioned that HIV/AIDS epidemiology data continually evolve; data sources should be consulted frequently for the most up-to-date information. • This slide set may be modified to include local or regional data for different jurisdictions. Users are asked to cite any additional data sources on Slide 8, “Where Do We Get the Data?”
Welcome! • Please sign in • Please complete: • Participant Information Form (“bubble form”) Now • Program EvaluationLater • Please silence cell phones & pagers
Learning Objective • At the end of this session, you should be able to: • Describe the current status and characteristics of the HIV & AIDS epidemic globally and in our community.
What is Epidemiology? • The “study of the distribution and determinants of diseases in human populations:” • How often diseases occur in different groups of people and why • Factors that influence illness distribution • Focus on population groups
Why is This Important? Helps us describe: • Characteristics of general population • Scope of HIV/AIDS epidemic in our area • Plan for, evaluate strategies to prevent illness: • Indicators of risk for HIV infection & AIDS in our population
Where do we get the data? Global Epidemic: WHO/UNAIDS http://www.unaids.org/ United States: CDC http://www.cdc.gov/hiv/ California: CDPH-OA http://www.cdph.ca.gov/programs/aids/Pages/Default.aspx San Francisco: DPH http://www.sfdph.org/
According to WHO/UNAIDS, how many people are currently living with HIV worldwide? • Approximately 25 million • Approximately 33 million • Approximately 42 million • Approximately 58 million • Approximately 75 million
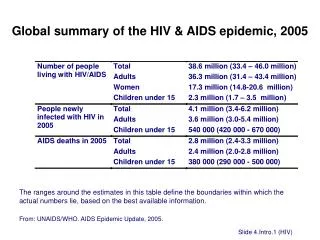
Adults & Children Estimated Living w/ HIV, 2008 Western & Central Europe 850,000 [710,000 – 970,000] Eastern Europe & Central Asia 1.5 million [1.4 – 1.7 million] North America 1.4 million [1.2 – 1.6 million] East Asia 850,000 [700,000 – 1 million] North Africa & Middle East 310,000 [250,000 – 380,000] Caribbean 240,000 [220,000 – 260,000] South & Southeast Asia 3.8 million [3.4 – 4.3 million] Latin America 2.0 million [1.8– 2.2 million] Sub-Saharan Africa 22.4 million [20.8 – 24.1 million] Oceania 59,000 [51,000 – 68,000] Total: 33.4 million (31.1 – 35.8 million)
Global Estimates (Adult & Child) Number of People Living with HIV in 2008: 33.4 million New Infectionsin 2008: 2.7 million Deaths Due to AIDS in 2008: 2.0 million
2008: +7,400 New Infections A DAY • >97% in low/middle income countries • ≈ 1,200 children <age 15 • ≈ 6,200 adults age 15+, of whom: • almost 48% women • about 40% among young people (age 15 – 24 years)
According to CDC, how many people are estimated to be living with HIV/AIDS in the U.S.? • About 150,000 • About 250,000 • About 500,000 • About 1 million • About 1.5 million
AIDS Surveillance Summary San Francisco 3/31/2010 Cumulative cases 28,477 Cumulative deaths 19,104 California 9/30/2009SF: 18% Cumulative cases 155,208 Cumulative deaths 86,809 United States 12/31/2007CA: 14.5% SF: 3% Cumulative cases 1,051,875 Cumulative deaths 583,298 Est. 1,106,400 PLWH/A in US @ end 2006 [CDC]
US Cumulative AIDS Cases: Top 10States 1 6 7 5 9 2 8 4 3 10: Puerto Rico
US Cumulative AIDS Cases: Top 10 Metro Areas • New York City, NY • Los Angeles, CA • San Francisco, CA • Miami, FL • Washington, DC • Chicago, IL • Houston, TX • Philadelphia, PA • Atlanta, GA • San Juan, PR
HIV in the U. S. – June 2010 • Prevalence = higher than ever before • Incidence = relatively stable in recent years • 21% unaware of infection ( from 25%) • in reported diagnoses • Certain populations, geographic areas disproportionately affected
AIDS Reporting began March ‘83 HIV Named Reporting began April ‘06
Specimen CA Name-Based HIV Reporting Health Care Provider Laboratory 1. Lab Result 2. HIV-related Lab Report 3. 3. HIV Case Report Local Health Department Submits unduplicated HIV cases w/ completed HIV/AIDS Confidential Case Report form 4. CDPH State Office of AIDS Submits HIV case data after identifying information removed 5. US DHHS - CDC
HIV/AIDS in San Francisco 15,757 PLWH/A in SF at end 2008: • 6,509 HIV non-AIDS cases • 9,248 AIDS cases • 36% AIDS cases = “late testers” • 32% PLWH = not in care • 20% unaware of infection or not in care
San Francisco AIDS Incidence, Mortality and Prevalence by Year, 1980-2010
n=15,757 HIV/AIDS Cases in San Francisco Gender Ethnicity Risk White IDU Latino MSM Afr Am Male Other Female MSM IDU API/Nat AM Hetero/Unk Transgender
HIV/AIDS in San Francisco: Where? Distribution of persons living with HIV/AIDS by neighborhood San Francisco, 12/2008 Est. total pop. 808,976
The highest proportion of persons infected with HIV in the U.S. is among: • Asian and Pacific Islanders • African Americans • Hispanics/Latinos • Native Americans • Whites
The highest proportion of persons infected with HIV in San Francisco is among: • Asian and Pacific Islanders • African Americans • Hispanics/Latinos • Native Americans • Whites
The highest incidence of annual AIDS cases in the United States is among: • Adolescents • Injection drug users • Men who have sex with men • Women
Summary • More people living with HIV & AIDS now than ever before • In San Francisco, still most likely to be male, white, occurring among MSM & MSM IDU • People with HIV living longer due to ARV therapy; African Americans, women, IDUs, homeless have worst survival rates • People of color, gay men, women, young people, transgender persons disproportionately represented among new infections
Resources AETC National Resource Centerhttp://www.aids-etc.org/ AIDSinfo:DHHS Treatment Guidelineshttp://aidsinfo.nih.gov/ Centers for Disease Control & Prevention (CDC)http://www.cdc.gov/hiv/default.htm HIV InSitehttp://hivinsite.ucsf.edu/InSite National HIV/AIDS Clinicians’ Consultation Center:Warmline, PEPline, Perinatal HIV Hotlinehttp://www.nccc.ucsf.edu San Francisco Area AETChttp://www.sfaetc.ucsf.edu UNAIDS/WHOhttp://www.unaids.org/en/