Download
1 / 21
210 likes | 326 Views
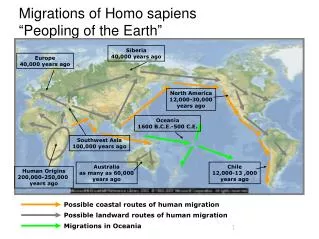
RI GHG Stakeholder Process Accomplishments First Five Years: 2001--2006. Modeling by Dr. Charlie Heaps Presented by Dr. Jonathan Raab June 15, 2006. Rhode Island GHG Emissions. Million Tonnes C Equivalent. GHG Saved in 2020 vs Baseline I+F+UD = 1.16 I+F = 0.64

E N D
RI GHG Stakeholder Process Accomplishments First Five Years: 2001--2006 Modeling by Dr. Charlie Heaps Presented by Dr. Jonathan Raab June 15, 2006
Rhode Island GHG Emissions Million Tonnes C Equivalent GHG Saved in 2020 vs Baseline I+F+UD = 1.16 I+F = 0.64 I = 0.53 (NEG/CP = 1.36)
Historic Note • RI GHG emissions now projected to drop below 2001 emission just from “Implemented” laws, policies, and programs through 2020. • In other words, we have successfully put in place sufficient “options” to more than offset all originally projected GHG growth through 2020 in business-as-usual baseline.
Comparison of “Implemented” GHGs for 2004/5/6 Thousand Tonnes C Equivalent
Comparison of “Implemented+Finalized+Under Development” GHGs for 2004/5/6 Thousand Tonnes C Equivalent
Important Assumptions and Changes • Major change from 2005 to 2006 modeling was moving from placeholder GHG savings per option from the original Plan, to actual projected GHG savings from finalized/implemented laws, policies, and programs (for most options). • Natural Gas combined cycle (NGCC) is assumed to be on the margin for electricity generation, so any reductions in demand due to energy efficiency or increases in renewable generation versus baseline avoids NGCC emissions. (This is a conservatism.) • Appliance bill assumed signed (implemented). • New CAFE standards would provide approximately 20% of the benefits provided by Pavley: these are not shown separately but included in Pavley. • Energy efficiency GHG savings reflect avoided emissions from electric generation, but options interact with each other and with RPS option, so savings are approximate.
Baseline Emissions • Baseline projections through 2020 have not been remodeled. • Increasing current and projected energy prices (gasoline, natural gas, fuel oil, and electricity) will likely reduce baseline emissions and thereby decrease necessary GHG reductions to meet the targets (all else being equal).
Comparison of 2020 Savings Estimates for I+F+UD in 2006 vs. 2005 estimates. • Savings estimates similar to 2005 (differ by only 50 thou TC eq). • Bigger savings from transport measures (420 vs 296 thou TC eq.) • Bigger savings from energy efficiency (356 vs 271 thou TC eq.) • Smaller savings from forestry & land-Use (56 vs 177 thou TC eq.) • Evaluation of CHP revised: yields smaller savings (47 vs 97 thou TC eq.)
Contribution by Sector to the Implemented ScenarioGHG Savings in 2010 and 2020 Thousand Tonnes C Equivalent
Contribution by Sector to the I+F ScenarioGHG Savings in 2010 and 2020 Thousand Tonnes C Equivalent
Contribution by Sector to I+F+UD ScenarioGHG Savings in 2010 and 2020 Thousand Tonnes C Equivalent
GHG Savings in 2020Summarized by Option for 3 Scenarios Million Tonnes C Equivalent
Share of GHG Savings in 2020Summarized by Option for 3 Scenarios % Share of Savings
GHG Savings in 2020Detailed Options for 3 Scenarios % Share of Savings
Transport OptionsGHG Savings in 2010 and 2020 (I+F+UD) Thousand Tonnes C Equivalent
Energy Efficiency OptionsGHG Savings in 2010 and 2020 (I+F+UD) Thousand Tonnes C Equivalent I= Implemented F = Finalized UD = Under Development
RPSGHG Savings in 2010 and 2020 Thousand Tonnes C Equivalent
Forestry and Land-Use OptionsGHG Savings in 2010 and 2020 (UD) Thousand Tonnes C Equivalent