Download
1 / 20
200 likes | 415 Views
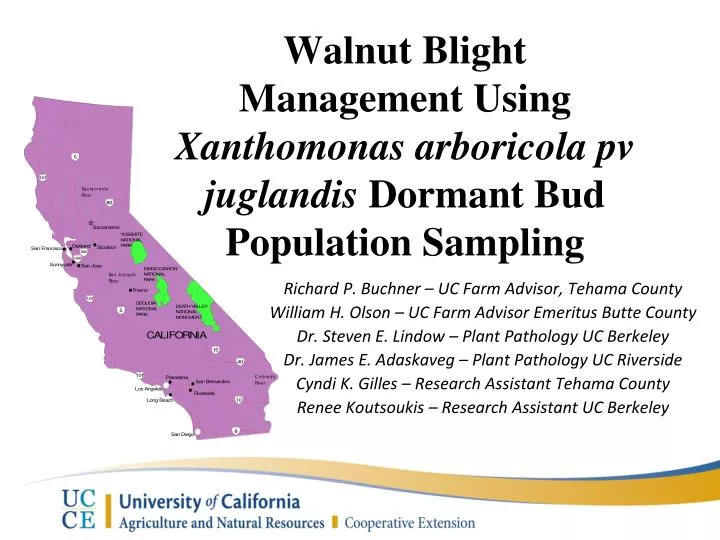
Walnut Blight Management Using Xanthomonas arboricola pv juglandis Dormant Bud Population Sampling. Richard P. Buchner – UC Farm Advisor, Tehama County William H. Olson – UC Farm Advisor Emeritus Butte County Dr. Steven E. Lindow – Plant Pathology UC Berkeley

E N D
Walnut Blight Management Using Xanthomonas arboricola pv juglandis Dormant Bud Population Sampling Richard P. Buchner – UC Farm Advisor, Tehama County William H. Olson – UC Farm Advisor Emeritus Butte County Dr. Steven E. Lindow– Plant Pathology UC Berkeley Dr. James E. Adaskaveg– Plant Pathology UC Riverside Cyndi K. Gilles – Research Assistant Tehama County Renee Koutsoukis – Research Assistant UC Berkeley
Walnut Blight infestation in Northern California Xanthomonas arboricola pv juglandis
Blight History – Vina VarietyTehama County, California 2011 Spray Schedule: 6.74 Kg/Ha Kocide 2000 + 2.7 Kg/Ha Pro-Stick 4/12, 4/26 and 5/5 2012 Spray Schedule: 4.49 Kg/Ha Badge + 2.7 Kg/Ha Manzate 4/16 and 5/2
2012 Vina Walnut in Tehama County, California Xaj Histogram for Medium Blight Rating 6.0 5.0 4.0 Log (Cfu/bud) 3.0 2.0 1.0 0.0 1 2 3 4 5 6 7 8 9 10 11 12 13 14 15 16 17 18 19 20 21 22 23 24 25 26 27 28 29 30 Bud # 10% infested buds (no nut drop) 40% infested buds (0 to 30 nuts) 67% infested buds (30 to 100 nuts) (30 to 100 nuts) 50% infested buds (over 100 nuts)
(G) or (A) indicates ground or air applications. (H) indicates half sprays every other row alternating. B=Badge at 4.49 Kg/Ha, M=Manzate at 2.7 Kg/Ha, S=Freeway at 292.30 ml/Ha and Z=Zinc Sulfate 36% at 1.12 Kg/Ha.
Walnut Blight damage for 14 walnut orchards in Tehama County from 2010 to 2013. Blight damage is increasing in one orchard with a history of high initial inoculum.
Walnut Blight damage for 15 walnut orchards from 2011 to 2013. Improved spray programs plus a low disease pressure year resulted in much better disease control in 2013.
Relationship of % buds with pathogen and the associated bud population. Very strong correlation of incidence of bud infestation with average population size of pathogen – disease prediction can be made based on more easily measured incidence of infestation rather than average population size. The lines drawn represent the linear regressions Y=0.0308X + 0.055 (R2=0.967) (2012); and Y=0.0398x + 0.067 (R2=0.626) (2013).
Relationship between the % buds infested with pathogen and the % walnut blight damage for 30 orchards in Butte and Tehama counties for 2012. The lines drawn represent the linear regression Y=0.218x – 0.28 (R2=0.56); and Y=0.001x + 0.14 (R2=0.001) for orchards in Butte and Tehama counties, respectively.
Relationship between the % buds infested with pathogen and the % walnut blight damage for 30 orchards in Butte and Tehama counties for 2013. The lines drawn represent the linear regressions Y=0.039x + 0.067 (R2=0.626); and Y=0.032x – 0.096 (R2=0.58) for orchards in Butte and Tehama counties, respectively.
Walnut Bud Sampling Methodology • Sample buds in December, January, February, March or early April for late leafing varieties. Buds can be sampled to the time they start to open. Early samples will allow more time to design disease control strategies.
Select 100 dormant walnut spurs with nice fat terminal buds. Cut off about a 3 inch length. Spurs reachable from the ground are easy to collect and represent a good sample location because bacteria sprinkle down through the tree canopy.
Walk the entire area collecting a random sample. One or two buds per tree should spread the sample adequately. Deciding how many samples to collect will depend upon experience on an orchard by orchard basis. One sample could easily represent 50 acres if experience suggests reasonable uniformity.
Save spurs in a paper bag and store in a cool dry place. The paper bag will allow samples to breathe and eliminate condensation. Mail or transport buds to a lab. The lab will select a 30 terminal bud subsample to plate on agar and save the remaining buds as a backup sample.
Walnut orchards can be highly variable. Try to achieve as representative sample as possible.
In California, samples can be analyzed at the California Seed and Plant Lab. www.calspl.com 916-655-1581
Incidence of populations of X. juglandis on walnut buds sampled following harvest on 12/1/10. This is a histogram typical for a low population sample. Notice that over 25 buds had zero pathogen.
Incidence of populations of X. juglandis on walnut buds sampled following harvest on 12/1/10. This is a histogram for a high population sample. Notice that only 8 buds had no detectable pathogen and most of the buds were in the ten to the fourth (10,000 colony forming units) or more range. This would be an example of a high risk orchard.
Additional Information cetehama@ucanr.edu(Buchner website) walnutresearch.ucanr.edu(California Walnut Research Reports) www.calspl.com(California Seed and Plant Lab) Thank you