Download
1 / 21
210 likes | 224 Views
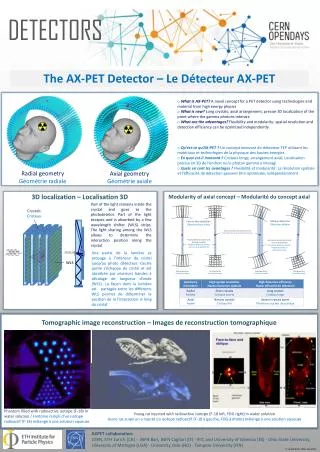
DETECTORS. *As the name implies the detector “detects the presence of compound/s after the compound/s presence in the gas or liquid stream is eluted from the column. Importance Detector Characteristics Sensitivity ------ implies detector response with the

E N D
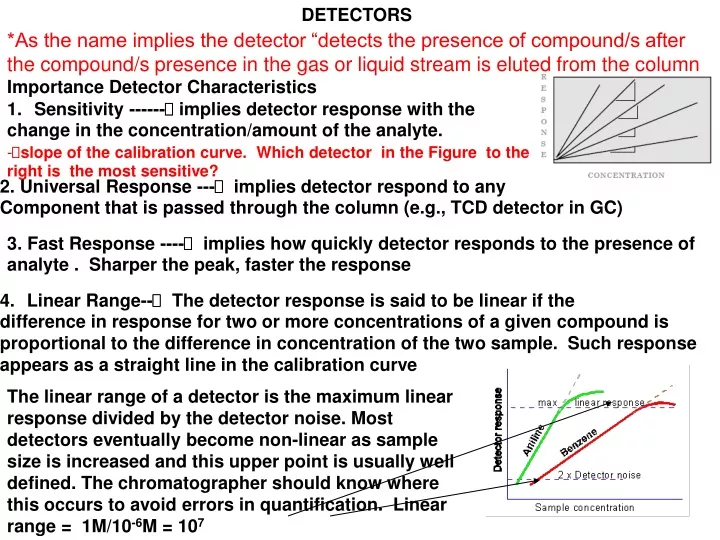
DETECTORS *As the name implies the detector “detects the presence of compound/s after the compound/s presence in the gas or liquid stream is eluted from the column • Importance Detector Characteristics • Sensitivity ------ implies detector response with the • change in the concentration/amount of the analyte. -slope of the calibration curve. Which detector in the Figure to the right is the most sensitive? 2. Universal Response --- implies detector respond to any Component that is passed through the column (e.g., TCD detector in GC) 3. Fast Response ---- implies how quickly detector responds to the presence of analyte . Sharper the peak, faster the response • Linear Range-- The detector response is said to be linear if the • difference in response for two or more concentrations of a given compound is • proportional to the difference in concentration of the two sample. Such response • appears as a straight line in the calibration curve The linear range of a detector is the maximum linear response divided by the detector noise. Most detectors eventually become non-linear as sample size is increased and this upper point is usually well defined. The chromatographer should know where this occurs to avoid errors in quantification. Linear range = 1M/10-6M = 107
Short term noise Long term noise Drift 5. Good Stability----- implies less electronic noise and less baseline drift Types of Noise Short term noiseconsists of baseline perturbations that have a frequency that is significantly higher than that of the eluted peak. Short term detector noise can be easily removed by appropriate noise filters without affecting the profiles of the peaks. Its source is usually electronic Long term noiseis perturbations that have a frequency that is similar to that of the eluted peak. Long term noise is the most damaging as it is indiscernible from very small peaks in the chromatogram. Long term noise cannot be removed by electronic filtering. In above figure, the peak profile can be discerned from the high frequency noise, but not from the long term noise. Long term noise arises from temperature, pressure and flow rate changes in the sensing cell or irregular column bleed. Long term noise ultimately determines the limits of detector sensitivity or the minimum detectable concentration. Drift results from baseline perturbations that have a frequency much smaller than that of the eluted peak. Drift can be due to changes in ambient temperature, changes in mobile flow rate, or column bleed in GC; in LC drift can be due to pressure changes, flow rate changes or variations in solvent composition. A combination of all three sources of noise is shown by the lowest profile in the above Figure
6. Background Noise ---- implies signal produced by the detector in the absence of a sample or solute Background noise is the constant signal apparent above a zero level baseline in the chromatograph chart. The sensitivity of a GC analysis is judged by the signal to noise ratio (S/N) If the background noise increases, this in turn reduces the sensitivity of analysis. major source of GC chromatogram background noise is from the GC injection port and its various components. GC septa have long been recognized as an important source of GC background noise. Manufacturers have developed and now offer a wide variety of Low bleed septa to reduce this source of background noise. Manufacturers of these septa have also developed elaborate cleaning and conditioning procedures to minimize septa bleed.
Reliability of a detector - implies how rugged the detector is for longer period • of use. Can we use detector for longer period of time without having baseline drift • Ease of Operation-- implies how easy it is to operate and understand a • detector without having baseline drift Some of these characteristics are complementary to each other High senstivity ------------------ Low background noise, fast response Hiigh stability --------------------- Low background noise
Detector noise is defined as the maximum amplitude of the combined short– and long-term noise measured over a period of 10 minutes (the E19 committee recommends a period of 15 minutes). The detector is connected to a column and mobile phase must be passed through it during measurement. The detector noise is obtained by constructing parallel lines embracing the maximum excursions of the recorder trace over the defined time period (see figure ). The distance between the parallel lines measured in millivolts is taken as the measured noise (vn), and the noise level (ND) is calculated in the following manner. where (A) is the attenuation factor and (B) is the amplification factor. The Measurement of Detector Noise Signal The detector output is called Signal. Magnitude of signal is measured as (a) peak area and (b) peak height which is proportional to concentration of analyte Noise is the signal produced by the detector in the absence of a a sample. Noise is Caused by random fluctuations,electronic detector component, stray light, dust contaminations
Detection Limits and Signal-to-Noise Ratio -aka.limit of detection (LOD) is the lowest concentration in a sample that can be detected, but not necessarily quantitated under the experimental conditions. • The LOD is generally quoted as the concentration yielding a S/N of 2:1 and is confirmed by analyzing a number of samples near this value using the equation • hsignal = height of the peak corresponding to the component; hnoise = absolute value of the largest noise fluctuation from the baseline of the chromatogram of a blank solution • - Since the LOD is dependent on the S/N, it can be improved by enhancing the analyte signal or reducing the detector noise • The signal can be improved by increasing the peak sharpness (efficiency). • increasing the injection volume or mass injected • The signal in GC can be increased by working at optimum flow rate and high temp (without column bleed) • The signal in HPLC can be increased by optimizing the mobile phase (liquid) composition or longer path lengths (if UV detector is used) Noise can be reduced by (a) high sensitivity detector with low noise, (b) low drift (c) slower detector response, (d) mobile phase with low UV absorbances and pump with low pulsation in HPLC Unit of LOD GC = g/sec (mass flow) or g/mL(conc flow); HPLC = mM or mg/mL
Sensitivity:: Defined as “signal output per unit concentration or per unit mass of an analyte in the carrier gas or liquid M.P” Minimum detectability R Upper limit of Linear range Concentration (mg/mL) (B) (A) Sensitivity = m = slope of the calibration plot m = DS/DC A compounds was eluted and then detected on two different TCD obtained from two different manufacturer. Which of the two detector will provide better LOD? In chromatogram A ( to the right ) the species display a larger response than B. However, MDL will be lower in B (left Figure) than A because of much lower background noise in B. S/N decreases with increase in Noise In this case inrease in Noise >> increase in Signal
Improve sample throughput We learned that the desirable characteristics of a detector system as follows: High sensitivity, Universal response, Wide linear dynamic range Good stability, Low background noise, Reliability, Ease of operation Q1. Which of the above characteristics do you consider to be most important in Quantitative Analysis? Wide linear dynamic range Good stability because we do not want peak areas to change from day-to-day Environmental Analysis “implies trace work” High Sensitivity Low Background Noise (gives lower LOD) Good Stability In a Laboratory with a Very Heavy Work Load “Busy Lab” Ease of operation Reliability
Type of GC Detectors ECD FID TCD Other Detectors Most commonly used GC detector with reducing cost of MS, it may compete with FID
Thermal Conductivity Detector What is Thermal Conductivity (l)? --Ability of a material to transfer heat when subjected to a temperature difference What does Thermal Conductivity Detector Measures? --Changes in l of the carrier gas caused by the presence of eluted solute --Since Dl = lanalyte -l M.P --Therefore, direction of peak may be positive or negative What type of carrier gas is commonly used with TCD and why? ---He is the most commonly used carrier gas of choice when chosing TCD because of its high thermal conductivity Working: (a) Body of detector is thermostated and two small filaments are mounted on 2 flow channels (a) Analyte (sensor) filament and (b) reference filament Solute elutes from the column and enters the analytical (sensor) channel, upon entering the Channel TC of M.P decreases and temperature of the wire filament increase -- increase resistance - decreases thermal conductivity Reference Cell is used through which only M.P passess --- corrects for (see next page)
What is the purpose of a reference cell in TCD? Reference cell is used through which only M.P passes and it corrects For (a) variations in flow rate, (b) electric power surges, (c) carrier gas Pressure. All of these three factors can change the filament resistance We have learned that in TCD response depends on “change in thermal Conductivity (Dl) or changes in resistance DRf between the carrier gas molecules and the solutemolecules.” Which analyte will provide the lowest LOD using heliumas carrier gas? Clearly chloroform Response Equation: STCaC Vmol DT Cv C = analyte concentration; DT temp difference b/w hot filament and cell; Cv = specific heat; Vmol = molecule velocity Greater the DT, greater TCD Increase in concentration and velocity of the analyte also increases TC TC with in CV
Advantages of TCD Responds to all compounds (Universal detector) Increasing sensitivity with decreasing temperature, flow rate and currrent Good linear and adequate sensitivity for many compounds Adequate sensitivity to many compounds Simple cheap robust and easy to use Nondestructive (posible to isolate solutes with a post dedector cold trap Why the peak for H2 is negative? Disadvantages *Poor LOD *Less sensitive than FID by atleast 103 orders of magnitude Poor senstivity when used in combination with capillary columns
Basic Operation Principles (a) Organic compounds (analyte) is burned in a mixture of H2/air flame -CH------ CH . (b) When the two gases (H2/air) are mixed together in the reaction zone and oxygen becomes available, the following Chemical ionization reaction occurs –CH + O ------ CHO+ + e- . . Flame Ionization Detector (FID) CHO+ radicals are reduced at a cathode and electrons move towards anode, which produces a current proportional to the radical quantity. About 10-12A Potential difference had to be maintained between the jet and the collector electrode. But why? Burning the analyte in flame generates ions and elctrons but unless there is a potential difference between the jet and the collector electrode no electrons will flow -- and no ionization current is detected.
What do you think the sensitivity of FID depends on? Ion production is directly proportional to the number of carbon atoms entering the flame. For example C6H14 > C5H12 (A) Hence, response to specific organic depends on the number of organic carbons(shown on the right) • Specific for organic carbon, insensitive to • inorganics, CO2, SO2 etc (see Figure B on the right) Modified form of FID --FID can be modified to respond to gases listed In Table B only if we work in hydrogen-rich mode with oxygen to support combustion. This Can be accomplished in most commercial FIDs By (a) introducing O2 with the carrier gas (b) Introducing H2 fuel using air inlet This modified form of FID is called “Hydrogen- Atmosphere flame ionization detector (HAFID) With LOD 10-8---10-11 g/sec Do you think FID can be useful for analysis of Atmospheric and aqueous environmental samples? If yes, why? Yes, because most of the gases (e.g., H20, CO2, H2S) do not respond when present As aqueous or environmental (gaseous matrix in the samples (e.g., PAHs in smoke)
Advantages of FID 1. Almost universal response to all organic compounds Mostly carbon containing compounds except those with carbonyls and carboxyl gps • Wide linear dynamic range makes FID an excellent detector for accurate • Quantitative analysis ---Upto 107 orders of magnitude in dynamic range. • Higher sensitivityGenerally DL are 100 x time less than the TCD. The DL Is about 10-12 g/sec Limitation of FID Water, inorganic gases, HCOOH, HCHO sameple cannot be done and they are Destroyed.
Application: Analysis of Gasoline Using FID A typical example of ubiquitous Hydrocarbon analysis in gasoline is shown on the right. The column was 100 m long, 250 mm I.D carrying a film of S.P (0.5 mm) Thick. The S.P was poly(di- methyl siloxane) that was intra- column polymerized and bonded to the surface. The column was held at 3500C after injection for 15 min and then programmed to 200 0C at 200C/min and finally held at 2000C for 5 min.
Electron Capture Detection ECD • A) The detector consists of a pair of electrodes • Outer source electrode (+) • Central collector electrode (-) B) Central collector electrode consist of a b-radiation emitter (e.g., 63Ni), which emits electrons Ni-63 => e- Principles of Operation Carrier gas (e.g., N2) when flows through the detector is ionized by the emitted electrons resulting in the production of additional electrons as shown below: e- + N2 => 2e- + N2+ The production of electron result in a constant current that is detected by the outer source electrode (anode), resulting in a high baseline signal -When with a “high affinity for capturing electrons” elutes from the column and enter the detector cell the electric current is decreased. Why? This is because solute molecules (e.g., AB) capture electrons as they pass through the detector cell AB + e- ----------AB- This negatively charged molecular ion (AB-) is then neutralized by the ionized nitrogen (N2+) AB- + N2+ ------------------- ABN2 (neutral molecule) ---As a result there is a decrease in current, which serve as an anaytical signal
Sensitive to electron withdrawing groups (high electron affinity) especially towards organics containing –F, -Cl, -Br, -I also, -CN, NO2. Therefore, the detector is very sensitive to Halogens, nitriles, carbonyl and nitro compounds Best for detection of solutes with electronegative functional groups Not senstive to amine, alchohols and aliphatic hydrocarbons
ECD Characrtersitics (the good) • VERY low DLWidely used for the determination of pesticides, herbicides and PCBs in environmental samples. Thus, widely used for detected species 10-15g/s of many halogenated substances (PCB, DDT etc). OK dynamic range of 104. Non-destructive • The bad) • Radioactive Ni-63 source • EASILY contaminated with O2, H2O, sample overloading. High maintenance device. • Highly variable response to halogenated substances, see table on previous page Can be a real headache when method developing a specific analysis, e.g. CH2Cl2 in the presence of CCl4.. For some other halogenated chemicals ( 1ppm hexachlorocyclohexane) could ruin the detector by contaminating it with excess of analyte. Sometimes complementary information from FID helps.
Dynamic Range 106-107 103-104 102-103 Variable 105-107 105 105 105 102