Download
1 / 22
230 likes | 347 Views
SO441: Week 1. Principles of weather forecasting. General approach to forecasting. Requires answers to the following questions: What physical processes and which weather systems will affect the forecast location during the forecast period?

E N D
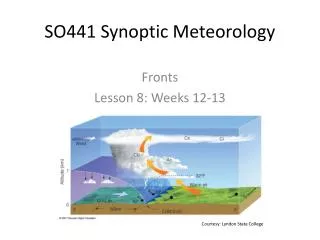
SO441: Week 1 Principles of weather forecasting
General approach to forecasting • Requires answers to the following questions: • What physical processes and which weather systems will affect the forecast location during the forecast period? • Where were the key weather systems in the recent past, and where are they currently? How are they expected to evolve leading up to the forecast period? • Were the expected processes operating at the forecast location in the recent past, and are they operating now? • In what way will the expected processes and weather systems specifically affect weather conditions in the forecast location?
My approach to forecasting • Where am I forecasting for? • What am I forecasting for? • Temp? Precip? Cloud cover? Wind? • When am I forecasting for? • Short term (0-1 days)? • Longer term (2+ days)? • What details/climatological info do I know (or can I find out) about the area? • What information is available? • Surface, upper-air, radiosonde, satellite, radar, model? • Have others already issued a forecast? • Either myself/my group previously for the same area, or another agency (e.g., NOAA or local National Weather Service) for the general area
My approach to forecasting • Start with the current “big picture” • Water vapor satellite imagery http://rammb.cira.colostate.edu/ramsdis/online/loop_640.asp?product=goes-east_16km_psir3 • Upper-air charts
My approach to forecasting • Zoom to the regional • Surface data, regional visible satellite, regional radar (if appropriate)
My approach to forecasting • Focus on the local • Upper-air sounding, radar
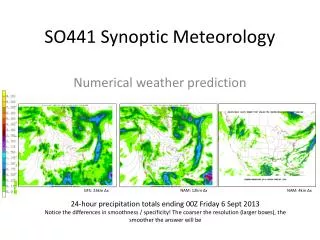
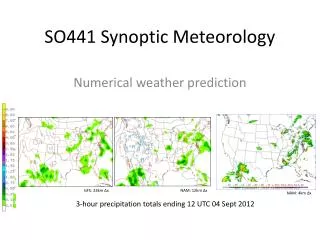
My approach to forecasting • Then turn to model data
My approach to forecasting • Start with the current “big picture” • Water vapor satellite imagery • Upper-air charts • Zoom to the regional • Surface data, regional visible satellite, regional radar (if appropriate) • Focus on the local • Upper-air sounding, radar • Then turn to model data
Forecast process • Background information • Geography, topography, vegetation, elevation • Climatology: typical regimes? • Local time of sunrise and sunset, declination angle • Nearby observing stations: surface, upper-air • Mesoscale site characteristics (urban, rural, near body of water) • Current climatology: drought, flood, heavy snow?
Planetary, synoptic, and mesoscale context: the forecast funnel • Focusing only on local conditions will lead to erroneous forecast • Weather to affect an area will likely have traveled large distances to arrive there • Or possibly not even have formed
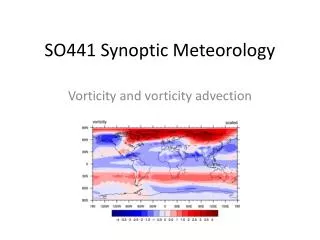
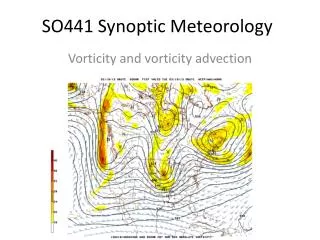
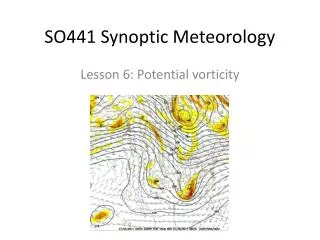
Planetary, synoptic, and mesoscale context: the forecast funnel • Hemispheric: • What characteristics of the planetary-scale pattern are relevant? • Upper-level troughs? Ridges? • Jet stream speed • Any anomalies? • 500-mb geopotential height + sea level pressure
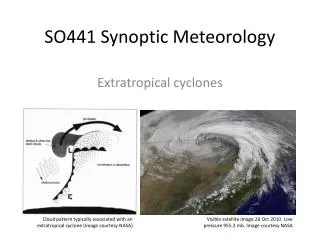
Planetary, synoptic, and mesoscale context: the forecast funnel • Synoptic • Weather systems (low or high pressure) affecting the area both currently and in future • Close attention to model development of future systems • Satellite + radar imagery, upper-air and surface charts
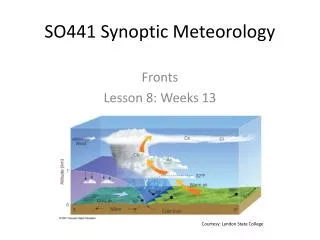
Planetary, synoptic, and mesoscale context: the forecast funnel • Mesoscale • Frontal systems, • Current precipitation • Bodies of water and the sea surface temperature/expected wind direction
Forecast parameters • Maximum & minimum temperature • Precipitation • Wind speed and sky cover • Other relevant issues, more specific to the needs of the recipient of the forecast (visibility, air quality, heat index/wind chill, severe thunderstorms, etc.)
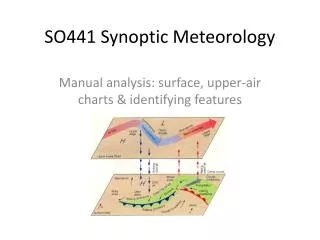
Weather briefing • Start with a big picture of current conditions • Include any items of interest: large storms, tropical cyclones, “interesting weather” anywhere in the globe • Be sure to give context and explain any items highlighted in the big picture • Move down the forecast funnel to the regional, then local scales • Turn to model data: short-term NAM, long-term GFS • Upper-levels (500 hPa, 300 hPa, 700-850 hPa) • Surface: MSLP, temperature, dew point temperature, wind direction/speed • Precipitation
Rules of Isoplething • Never violate a valid data point. Only in extreme and defendable circumstances should data be omitted. Analyze for all given data. • Interpolate as much as possible. Allow for extreme packing of isolines if that is defendable. • Smooth isolines and, whenever possible, keep pacing consistent. • Do not analyze for what does not exist. Do not assume data. • There should be no features smaller than the distance between data points. • Isolines cannot intersect nor can they suddenly stop. Just as data is continuous, so are isolines. The exception to this is naturally at the end of a page. • Label all closed isolines with appropriate markings (i.e. "H" or "L") in bold and large letters. Label the maximum and minimum values with a small underline. • Label the ends of the lines neatly and consistently. Make sure that any abbreviations are understandable. Title the map and include time. • Analyze in even multiples of the interval of analysis. • Remember that each line must represent all areas with the specified value. On one side of the line, values will be lower than the value on the line and on the other side, values will be higher. • Use a good pencil and initially sketch lines lightly. If needed, make them smooth by darkening the lines after you know where they should be placed. • Have a good eraser handy. • Start with a line that gives you a good understanding of what is happening. This may be in the middle or near the extremes. Use this line as a guide to draw the rest of the isolines. • When the lines become tricky to draw, consider all the alternatives. There may be a better way to draw the analysis. • Remember that the data is only a reflection of the actual atmosphere! Adapted from College of DuPage http://weather.cod.edu/labs/isoplething/isoplething.rules.html
Surface temperature • Contour the “10s” (0°F, 10°F, 20°F, etc…) • Contour every 10 degrees F • You could contour every 5° F if you wish more detail, or are focusing on a regional analysis
Surface pressure • Contour the “4s” (1000 mb, 1004 mb, 996 mb, etc.) • And thus contour every 4 mb • Remember the station model: if pressure is listed as “002”, that usually means 1000.2 mb. Pressure of “994” means 999.4 mb.
Dew point temperature • Convention not as established. • Should try to include the 10s (50°F, 60°F, etc.) • Depending on interest, can contour every 10°F, every 5°F, or even every 2°F • Every 2°F would only be on a regional analysis • Also depending on focus (i.e., severe thunderstorms? Winter precip? Drought?) can omit low or high values • Example: start at 45°F and contour every 5°F to 75°F, if focusing on identifying the dryline and thunderstorm possibilities • Example: start at 20°F and contour every 5°F to 50°F, if interested in wintry precip