Download
1 / 19
230 likes | 514 Views
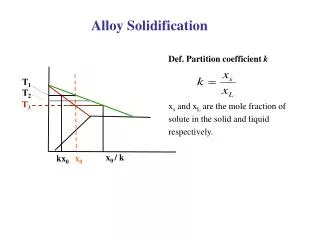
Solidification of Pb-Sn Alloys. Teri Mosher University of Illinois Advisor: Professor Krane. Presentation Overview. Dendrites Purpose Procedure Results. Dendrites . Primary Phases First phase to solidify Solid structures that form from a liquid Solidify in a branched style.

E N D
Solidification of Pb-Sn Alloys Teri Mosher University of Illinois Advisor: Professor Krane
Presentation Overview • Dendrites • Purpose • Procedure • Results
Dendrites • Primary Phases • First phase to solidify • Solid structures that form from a liquid • Solidify in a branched style 40 wt% Sn at 5·10-5m/s
Dendrites • The shape, size, and speed of dendrite growth influence the final properties of metals. • The morphology of the dendrites determines if the material is: • Soft • Hard • Strong
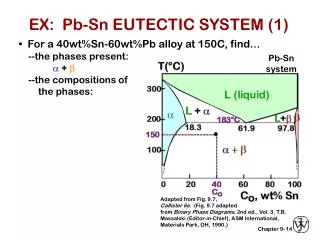
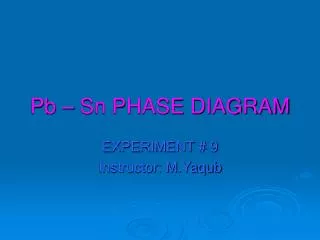
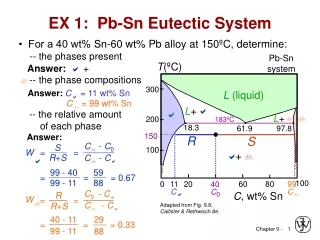
Pb-Sn Phase Diagram http://cyberbuzz.gatech.edu/asm_tms/phase_diagrams/
Purpose • To observe and analyze the microstructure of Pb-Sn alloys • To compare experimental data to that of a numerical model • Constrained solidification • Velocity • Temperature Gradient
2D Model of Dendrite GrowthPb-1 Wt% Sn V= 5·10-5m/s dT/dx = 10 K/mm 3.2 mm by 6.4 mm
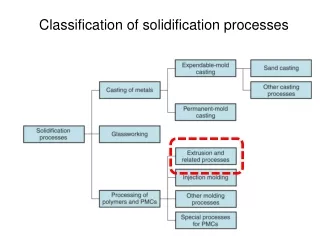
Procedure Pb-Sn Alloy • Melt samples of the alloy and draw into tube • In the furnace, heat the sample of Pb-Sn up to 400oC with a temperature gradient of 4.5oC/mm Quartz Tube Hot Zone Cold Zone
Procedure • Run the sample through that furnace with four different compositions each at three different velocities • 10wt%, 25wt%, 40wt%, 63wt% • Velocities 10-4m/s, 5·10-5m/s, 10-5m/s
Procedure • Mount each sample both horizontally and vertically • Polish in order to analyze the microstructure • Optical Microscopy
Results: 10 wt% Sn 200 m Velocity = 10-4m/s Velocity = 10-5m/s
Results: 25 wt% Sn 100 m Velocity = 10-4m/s Velocity = 10-5m/s
Results: 40 wt% Sn 100 m Velocity = 10-5m/s Velocity = 10-4m/s
Results: 63 wt% Sn 50 m Velocity = 10-5m/s Velocity = 10-4m/s
Results: Observations • At a slower velocity the dendritic branches are more coarse • The lower the weight percent of tin, the larger the fraction of primary solid.
Lever Law vs Scheil Scheil Equation Lever Law fs = Co - Ce 1 1-k Cα- Ce Fs = 1- (Co/Ce) • Diffusion of solute does not occur in solid • Diffusion of solute in liquid is rapid and complete • Equilibrium • Diffusion of both solid and liquid are rapid
Results: Conclusions • Velocity did not have much effect on the fraction of primary solid. • There was more diffusion occurring at higher compositions
Acknowledgements • National Science Foundation • Professor Krane • Srinivasan Raghavan