Download
1 / 9
90 likes | 237 Views
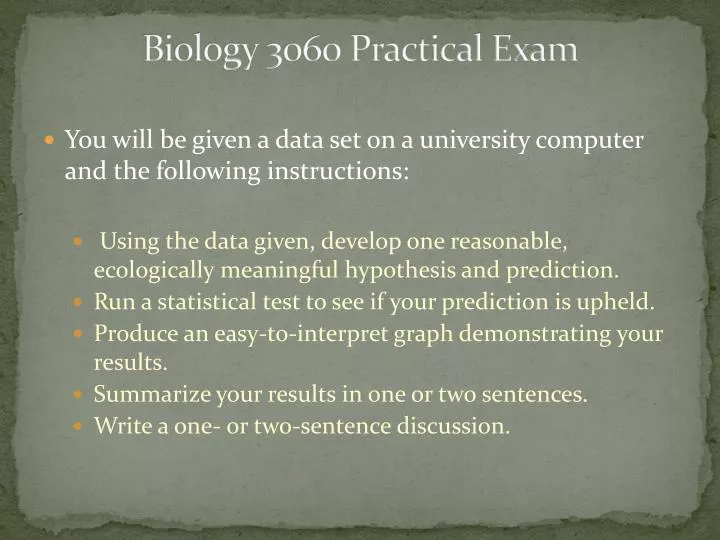
Biology 3060 Practical Exam. You will be given a data set on a university computer and the following instructions: Using the data given, develop one reasonable , ecologically meaningful hypothesis and prediction. Run a statistical test to see if your prediction is upheld.

E N D
Biology 3060 Practical Exam • You will be given a data set on a university computer and the following instructions: • Using the data given, develop one reasonable, ecologically meaningful hypothesis and prediction. • Run a statistical test to see if your prediction is upheld. • Produce an easy-to-interpret graph demonstrating your results. • Summarize your results in one or two sentences. • Write a one- or two-sentence discussion.
Statistical tables will be provided in the test spreadsheet. • This will be closed book and “closed computer.” No other windows on your computer may be open (minimized or not). No external devices such as jump drives are allowed. • July 17, 18
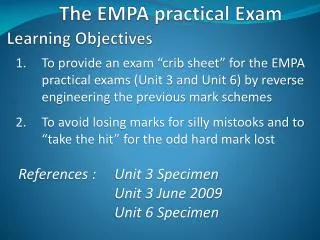
How to prepare? • The introduction to Excel lab and other past exercises • Summary of Statistical Tests (in the manual) • The example exam • Ask questions • Know how to figure d.f. • Know how to use the statistical charts
D.F. • If you’re off on d.f., you will miscalculate your p-value. • t-test: n1 + n2 – 2 • Correlation: n1– 2
t-test: n1 + n2 – 2how many d.f.?Correlation: n1– 2how many d.f.?
How do you know which test to use? • t-test: You’re trying to see if there is a difference between the averages of two data sets. These data sets will always be in the same units. Each data point will be a single measurement. • Correlation: You’re testing to see if there is an association between two data sets. These data sets will usually be in different units. • Binomial:Gives the probability of getting results involving repetitions of an experiment which can have only two outcomes. Since these are repetitions, each data point is a count, not a measurement (frequency or % is the actual measurement). Also, binomial data are paired, t-test data are not.
A few more helpful points : • Be familiar with the following functions in Excel: AVERAGE, STDEV, CORREL, TTEST, COUNTIF, COUNTIFS, $, transpose, trend lines, error bars, reference formulas, sort, and axis titles and all other functions pertaining to charts. Freeze/unfreeze panes can also be helpful. • CORREL does not give a p value, TTEST does. • Which way is significant, greater than or less than 0.05? • Make sure your discussion doesn’t just restate your results. • If you get a significant p-value, do you support the prediction for your hypothesis or not? • In a correlation, a negative significant relationship is a significant relationship. If you get a negative r value, report it as such. Change a negative r to positive before looking it up in the chart.
Practice making graphs. They must be easy to understand and the axes must be labeled properly. Remember what goes on the x and y axes. • You will get little credit for unrealistic hypotheses even if the methods and statistics are good. For example, running a correlation between animals’ ear tag numbers and their weight. • Suggestions in your manual for presenting lab report results and discussion will help with this exam. • Non-significant results are results. • Don’t pick an analysis from the example and decide you will do that one. The data set on the practical will be different. Your favorite analysis might not be possible on the actual exam. • Most credit will go to those who demonstrate an understanding of the scientific method, statistics, and excel, and who can succinctly report and discuss results.