Download
1 / 15
150 likes | 204 Views
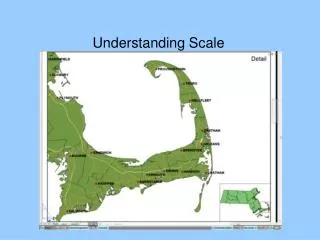
The scale of health inequality in England; from region to local authority district, 2006 –2008. Gbenga Olatunde and Andrew Yeap, 2011. What we’re going to talk about. Introduction Health Expectancy at ONS Annual Population Survey Disability-Free Life Expectancy Analysis at National level

E N D
The scale of health inequality in England; from region to local authority district, 2006–2008 Gbenga Olatunde and Andrew Yeap, 2011
What we’re going to talk about • Introduction • Health Expectancy at ONS • Annual Population Survey • Disability-Free Life Expectancy • Analysis at National level • Analysis by English Regions • Analysis by Area Deprivation • Analysis at Local Authority level
Health Expectancy at ONS • Health Expectancy – years expected to be spent in a favourable or unfavourable health state from a given age • Adds dimension of quality to Life Expectancy • ONS produce two HE metrics: • Healthy Life Expectancy (very good/good health) • Disability-Free Life Expectancy (Limiting long-standing illness/disability) • Annual production of HEs at National level using large-scale surveys: • General Lifestyle Survey (covers GB) • Continuous Household Survey (covers NI) • Sample size not large enough to allow statistically meaningful comparisons at lower-level geographies
Annual Population Survey • Collects data from private households around the UK • Consists of waves 1 and 5 of the Labour Force Survey, and additional boost cases for England, Wales and Scotland • Enables reliable analysis at lower level geographies • Analysis based on cross-sectional component of the APS
Data • Over 475 000 people aged 16 and over for 2006-08 • Morbidity data from ONS Annual Population Survey (APS) • Combined with mortality and population data to calculate DFLE according to the Sullivan method
Limiting long-standing illness or disability • Do you have any health problems or disability that you expect will last for a year or more? ‘Yes/No’ If ‘Yes’ the respondent is then asked; • Do these health problems or disabilities when taken singly or together, substantially limit your ability to carry out normal day to day activities? If you are receiving medication or treatment, please consider what the situation would be without the medication or treatment ‘Yes/No’ People responding ‘Yes’ to both questions were identified as having a limiting long-standing illness or disability
Males Females UK 48.3 49.3 GB 48.4 49.3 England 48.8 49.8 Wales 45.3 46.1 Scotland 45.6 46.8 NI 46.9 48.1 National level DFLE at age 16, APS 2006-08 From age 16, males and females in the UK can expect just under 50 more years of life free from LLSI England possess the highest DFLE and Wales the lowest Inequality between highest and lowest DFLE is 3.5 years for males and 3.7 years for females
Men at age 16 High High High High High High 44.2 years in North East 51.3 years in South East Women at age 16 Low Low Low Low Low Low 45.2 years in North East 51.8 years in South East Health Inequalities: Disability-free life expectancy by English region, 2006-08
Background • Health inequalities have enormous social and economic costs. Clear need to monitor population health to assess impact of interventions • If everyone in England had the same death and illness rates as the most advantaged, those dying prematurely as a result of health inequalities would have gained 2.8 million person-years free from limiting illness or disability • Sub-national analyses previously restricted to Census data or large aggregations of survey data
70 Years 65 Men 60 65.6 58.0 55 50 54.0 40.8 45 Women 40 35 Increasing deprivation 68.7 63.4 30 54.6 42.0 Life expectancy (LE) and disability-free life expectancy (DFLE) for men and women at age 16; by area deprivation, 2006–2008
Men at age 16 41.2 years in Barnsley High High High High High High 56.8 years in Surrey Heath Women at age 16 Low Low Low Low Low Low 41.7 years in Knowsley 60.2 years in Tandridge Health Inequalities: Disability-free life expectancy by English local authority district, 2006–08
Conclusions • Substantial inequalities in LE and DFLE across areas for men and women • Inequalities in DFLE much greater than in LE • Inequality in LE and DFLE between least and most deprived areas greater for men than women • For both men and women, the inequality in DFLE doubles with increasingly detailed geographical analysis
Future work • Update the study: produce estimates for 2007–2009 • Explore the use of other survey sources to provide proxy child data • Use of the Integrated Household Survey to produce estimates at national and sub-national levels
Thanks… • Any Questions? You can contact us by emailing: hle@ons.gov.uk www.ons.gov.uk www.youtube.com/user/onsstats twitter.com/statisticsONS