Download
1 / 30
300 likes | 452 Views
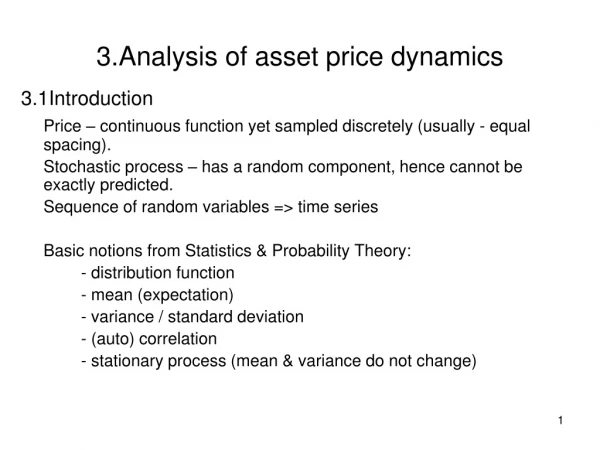
Estimating The Dynamics of Price Discovery. by Bingcheng Yan Numeric Investors and Eric Zivot Robert Richards Chaired Professor of Economics Adjunct Professor of Finance, Statistics and Applied Mathematics University of Washington May11, 2012. Presentation Outline. Background

E N D
Estimating The Dynamics of Price Discovery by Bingcheng Yan Numeric Investors and Eric Zivot Robert Richards Chaired Professor of Economics Adjunct Professor of Finance, Statistics and Applied Mathematics University of Washington May11, 2012
Presentation Outline • Background • Objectives and Contributions • Reduced Form Cointegration Model and Price Discovery Measures • Structural Cointegration Model • Dynamic Price Discovery Measures • Empirical Example Using Fx Data • Concluding Remarks
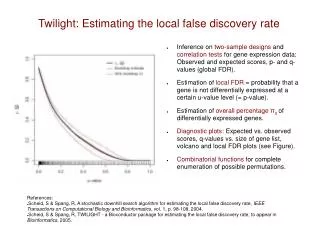
Background: Definitions • Price discovery • “The search for an equilibrium price” (Schreiber and Schwartz, JPM, 1986) • “The dynamic process by which markets impound new information” (Hasbrouck, JF, 1995) • The incorporation of the information implicit in investor trading into market prices (Lehmann, JFM, 2002) • One of the most important functions of financial markets
Background: Questions • Research questions • Does the proliferation of alternative trading venues and the resulting market fragmentation adversely affect price discovery? • How do the dynamics of price discovery depend on market characteristics such as trading costs, liquidity? • What institutional factors and trading protocols facilitate information aggregation and price discovery? • Which markets move first in incorporating new information? • Answers require econometric methodology for measuring the dynamics of price discovery
Background: Methodology • Institutional trend of financial markets • Trading of identical or closely related assets in multiple markets; • cross-listed stocks • stock index and index futures, • stock and stock options, • direct and implied exchange rates • Provides a mechanism to measure price discovery
Background: Methodology • A common implicit efficient price shared by multiple market prices – cointegration framework • Hasbrouck (1995) proposed a reduced form cointegration model for arbitrage linked multiple market prices and defined the information share measure of price discovery • Booth et al. (1999) used Granger-Gonzalo permanent-transitory decomposition and defined the component share measure of price discovery. • There exists substantial confusion regarding the interpretation of existing price discovery measures because they are based on reduced form residuals • Existing measures of price discovery are static in nature
Objectives and Contributions of This Paper • Propose structuralcointegration model with identified permanent and transitory shocks • Borrow SVAR methodology from empirical macroeconomics • Propose a new methodology for measuring the dynamic price discovery process • Price discovery impulse response functions • Price discovery efficiency loss measures • Illustrate the new approach with an empirical application to Fx markets • Price discovery between the US dollar implied JPY/EUR and the direct JPY/EUR rates • Investigate impact of trading costs and liquidity on price discovery dynamics
Reduced Form Cointegration Model Same asset trading in two arbitrage linked markets Note: time index represents high frequency intra-day data MA (Wold) Representation
Reduced form Cointegration Model Common Trends Representation:
Reduced Form Cointegration Model Common Efficient Price Representation:
Reduced Form Cointegration Model Empirical Model: Reduced Form VEC Model: Assume approximating VEC(K-1) model implied by infinite order cointegrated VAR Note: Johansen (1991) factorization
Permanent and Transitory Shocks Long-run impact of transitory shock Long-run impact of permanent shock Normalization imposed by common fundamental value Long-run impact matrix
Common Efficient Price Representation Pricing error contains reactions to both permanent and transitory shocks
Identification of Structural Cointegration • Parameters of structural model can be uniquely identified using a modification of the P-T decomposition of Gonzalo and Ng (2001, JEDC) • Identification does not depend on the ordering of the variables in the VAR
New Dynamic Measures of Price Discovery • Price Discovery Impulse Response Function (PDIRF): New information → market price response • permanently moves the efficient price, mt, and drives multiple market prices to mt in the long run • A direct characterization of how market prices discover the new efficient price
Dynamic Measures of Price Discovery • Price Discovery Efficiency Loss (PDEL) fik– 1 = pricing error w.r.t. new information L( ) = non-negative loss function K* = truncation lag
PDIRF and PDEL from Partial Adjustment Model L(∙) = abs(∙) PDEL = 1.5 PDEL = 0.25 PDEL = 4.0
Empirical Example: Price Discovery in Fx Markets • Empirical analysis of price discovery dynamics of the direct JPY/EUR rate and the US dollar implied rate (from JPY/USD and USD/EUR) • US dollar, major vehicle currency in Fx markets, has trillions of dollar daily turnover • Any news regarding JPY(EUR) may first or • Does liquidity and high trading volume imply more efficient price discovery in US dollar markets? • Who moves first? JPY/USD (USD/EUR) JPY/EUR
Data Set and Variables • Bid-ask quotes on spot Fx rates: USD/EUR, JPY/USD, and JPY/EUR, time stamped up to milliseconds in GMT • EBS (Electronic Brokerage Service) • Quotes are firm (tradable) • Sample: 12 business weeks, July 6 – September 26, 2003 • One business week: 22:00 Sunday – 22:00 Friday, GMT • Prices = log of mid quotes * 10000 (price changes in basis points) • Irregularly spaced quotes for all rates aligned to common time clock using “previous tick” method.
Data Set and Variables • Dollar implied rate for JPY/EUR • log mid quote (JPY/USD) + log mid quote (USD/EUR) • Spreads (measures of transaction costs & liquidity) • Bid/Ask spread • Bid/Ask spread ratio:
One Episode in Foreign Exchange Markets At 23:50 on Aug. 11, 2003, Japan released the first GDP estimates for the second quarter of 2003
Asian European American Post-American
Asian European American Post American
Figure 3 – 6. Price Discovery IRFs (15 – second resolution) Asian European Dollar implied JPY/EUR Direct JPY/EUR American Post-American
Figure 7 – 10. Price Discovery IRFs (5 – minute resolution) Asian European Dollar implied JPY/EUR Direct JPY/EUR American Post-American
Asian European American Post American
Conclusions • Propose new approach for the econometric analysis of price discovery dynamics based on structural cointegration model • Propose new measures of the dynamics of price discovery: PDIRF, PDEL • In application to Fx markets, show implied dollar JPY/EUR rate incorporates new information faster than direct JPY/EUR rate