Download
1 / 35
350 likes | 492 Views
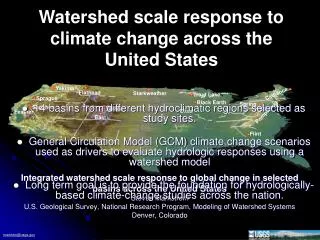
Economic Value of Water for Agricultural Production in SW Georgia Wa ter Summit XIV Meeting Georgia’s Water Demands in the 21 st Century Albany, GA June 17, 2008. Mark H. Masters ASU Flint River Water Policy Center. Outline.

E N D
Economic Value of Water for Agricultural Production in SW GeorgiaWater Summit XIVMeeting Georgia’s Water Demands in the 21st CenturyAlbany, GAJune 17, 2008 Mark H. Masters ASU Flint River Water Policy Center
Outline • What is the economic impact of agriculture to the Lower Flint River Basin and SW GA as a whole? • Farm gate, direct and indirect output/employment • What are the potential impacts of reducing irrigated acreage in Spring Creek and Ichaway sub-basins? • Scenarios from EPD planning documents • Assumptions • Irrigation and yield data • Basin and region level • Farm level impacts of reducing irrigation • Recent advances in knowledge base regarding agricultural water use • Discussion
Lower Flint-Ochlockonee Planning District • 14 Counties • All or part of 13 HUC 8 Watersheds • Ag irrigation is predominant use of water • 658,561 acres • Endangered species and critical habitat • GA – FLA – AL
Farm Gate Value Lower Flint = $1.820 billion GA = $11.5 billion
Flint River BasinAgriculture and Directly Related Businesses IMPACT Compiled by UGA Center for Agribusiness & Econ Development, Waters & McKissick, 2004
Concentration of modeling efforts in Ichaway and Spring Creek Sub-basins. • EPD surface water models indicate low-flow violations under some conditions • Especially Spring Crk • 326,204 permitted irrigated acres in these two basins • 153,263 (Ichaway) • 172,941 (Spring) • ≈ 62% of harvested land
This analysis was limited to all surface water w/drawals and those ground water w/drawals out of the Upper Floridan as determined by EPD • This amounts to roughly 241,000 irrigated acres • 100,890 in Ichaway • 140,130 in Spring • Ichaway region includes Terrell, Randolph, Calhoun, and Baker Counties • Spring Creek region includes Early, Miller, Seminole, and Decatur counties
Impact Model • IMPLAN • IMpact analysis for PLANning • Input–Output model describing commodity flows from producers to final consumers • Driven by purchases for final use or final demand (in our case, lost revenue from not irrigating) • Direct effects • Indirect Effects • Multipliers • Region specific • Base model (2006) or modified
Acreage Reduction by Crop Numbers shown in RED were provided by EPD. Peanut, cotton, and corn acreage is roughly 86% of the total irrigated acreage in these two basins. Assume all reduction from these crops w/ the following distribution: PN (30%), CT (45%), CN (25%)
Crop Assumptions a Yield and irrigation data collected during CY 2007 from USDA-ARS NPRL Multi-Crop Irrigation Research Farm. b 2007 Estimated Georgia Prices compiled by UGA CAES.
Multiplier IMPLAN Results
Irrigation Reductions Miller County Example
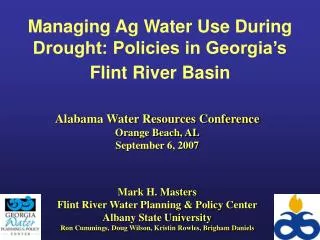
Flint River Drought Protection Act Inaugural auction held March 15, 2001 33,101 acres retired from irrigated production Average bid: $136/acre $4.5 million paid to growers Auction held again in 2002 40,894 acres retired Average bid: $128/acre $5.2 million paid to growers Major changes for Act after Flint River Water Dev. and Conservation Plan passed March 2006
Flint River Drought Protection Act • Designation of different “use” areas • Ground water now eligible for participation • Act may be targeted on smaller watersheds • “Partial” buyout of an agricultural permit • Involuntary suspension provisions
Farm Gate Value: $78.7 million Cotton (acres): 39,022 Peanut (acres) 21,744 Corn (acres) 5,064 Permitted Acreage 75,279 GW – 1,680 SW “Wetted” Acreage 64,768 GW – 937 SW
Capacity Use 17,757 27% Restricted Use 21,151 32% Consvn Use 26,797 41% Miller County Total 65,705 Irrigated Acres
Capacity Use 10,356 18% Restricted Use 21,134 35% Consvn Use 27,880 47% Miller County Total -- Within 3 Miles -- 59,370 Acres (90%)
Illustrative Purposes Only – Of the 10,356 acres within 3 miles of a stream and in Capacity Use Areas, 91% are “Grandfathered” Permits. It is extremely likely these areas could be impacted by a Flint River Drought Auction with economic impacts highly localized.
USDA/ARS National Peanut Research LaboratoryMulti-Crop Irrigation Research Farm
CY 2007 Cotton Revenues & Costs Not including returns to management, fixed assets, and overhead.
CY 2007 Corn Revenues & Costs Not including returns to management, fixed assets, and overhead.
CY 2007 Peanut Revenues & Costs Not including returns to management, fixed assets, and overhead.
$31.18/inch $33.58/inch $57.31/inch Caution: This is an average and irrigation is NOT a linear function
Moving Forward • We are better positioned to plan for agricultural water use …kind of • Data collection (revised models) • Outreach • Interaction and compilation of programs • Statutes • Conservation • Acceptance of irrigation scheduling, conservation tillage and system upgrade programs • Built-in conservation in the form of energy prices • Participation in planning process
Moving Forward We are better positioned to plan for agricultural water use …kind of Data collection (revised models) Outreach Interaction and compilation of programs Statutes Conservation Acceptance of irrigation scheduling, conservation tillage and system upgrade programs Built-in conservation in the form of energy prices Participation in planning process
Mark H. MastersASU Flint River Water Policy Centermmasters@h2opolicycenter.org 229-430-2900 x36