Download
1 / 8
80 likes | 212 Views
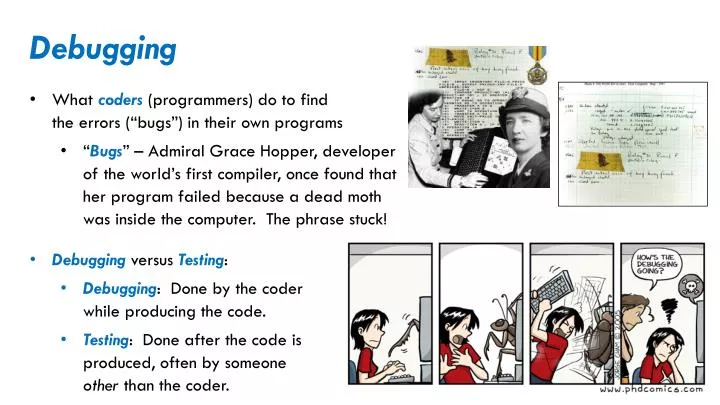
Debugging What coders (programmers) do to find the errors (“bugs”) in their own programs “ Bugs ” – Admiral Grace Hopper, developer of the world’s first compiler, once found that her program failed because a dead moth was inside the computer. The phrase stuck ! Debugging versus Testing :

E N D
Debugging • What coders (programmers) do to findthe errors (“bugs”) in their own programs • “Bugs” – Admiral Grace Hopper, developer of the world’s first compiler, once found that her program failed because a dead moth was inside the computer. The phrase stuck! • Debugging versus Testing: • Debugging: Done by the coderwhile producing the code. • Testing: Done after the code isproduced, often by someoneother than the coder.
Debugging is hard! • Bugs are run-time errors– that is, they are semantic errors (the program did not do what you intended), not syntactic errors (the program has an error in its notation that makes it impossible to run) • Bugs are hard to find and fix because: • Programs are big; finding the place where the bugis introduced may require examining many lines of code. • The bug may be an error that is spread across manylines of code. • The bug may be intermittent – the evidence of the bugmay come and go depending on the inputs, the state ofthe system, and much more. • Frequently the programmer doesn’t even notice the existence of the bug!
The Debugger • Debuggers: Tools that help with debugging, by allowing you to: • Run the programto a “breakpoint” that you set • Step through the program, line by line • See the valuesof the variablesas you do so
Starting the Debugger • Set breakpointsby double-clicking on the gray barto the left of the line numbers • Double-clicking on a breakpoint removes it • Run in the Debugger by selecting the “Bug” symbolto the left of the usual “Run” symbol • The first time it asks if you want to enter the Debug perspective in this situation. Check the box (“Remember my decision”) and select Yes. I double-clicked here to put a breakpoint at line 30. The program will stop at that line(just before that line runs) in the Debugger.
The Debug perspective shown in this and the subsequent slides has been simplified from the default Debug perspective. The Debug perspective The controls for running in the Debugger are here Restart a Debug run here This window controls which variables are shown – by default, the variables in the current function Your program is here, with indicators showing the line that is currently being executed This is the usual Console window for print statements This window shows the values of the variables, highlighting changes as the program runs
Running in the Debugger • The Debugger pauses the programat the first breakpoint that it encounters • It stops before it has run that line • The blue arrow shows the place where the programis currently paused, and that line is highlighted as well • You can set or remove breakpoints at any point during the run • By double-clicking on the gray bar next to the line • Run to the next breakpoint by using the green-arrow (“Resume”) button • If you want to stop the run, use the red-square (“Terminate”) button • If you want to re-run the program, use the “Bug” button again I added another breakpoint at line 36v
Stepping in the Debugger • The program stops at your first breakpoint • It stops before it has run that line • The blue arrow shows the place where the programis currently paused, and that line is highlighted as well • The control barallows you to: • Step Into – run the next statement of the program • If the statement is a function call, the Debugger enters that function • Step Over – run the next statement of the current function • If the statement is a function call, enter that function, do its stuff, and return from the function (thus “stepping over” that function call) • Step Return – run all the remaining statement in the current function and returning to the point at which the function was called • Resume – i.e., run to the next breakpoint
Examining variables in the Debugger • The Variableswindow shows variables and their values • At the point at which the program is paused • Variables in the current function are shown • Selecting a different function in the call stack shows its variables This example shows variables when the program is paused at line 37 The variable c was modified since the previous pause-point, so c is highlighted The window identifies the type of the variable The window typically shows the value of an object by showing some of its fields. You can expand variables to see their fields. In the example to the right, I have expanded c (the Circle), then expanded its field p2 (a Point). See http://pydev.org/manual_adv_debugger.html if you want to learn more about the Pydev debugger.