Download
1 / 18
180 likes | 296 Views
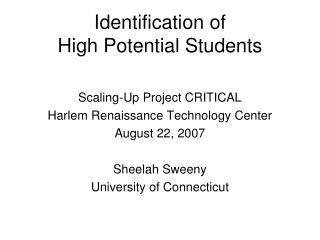
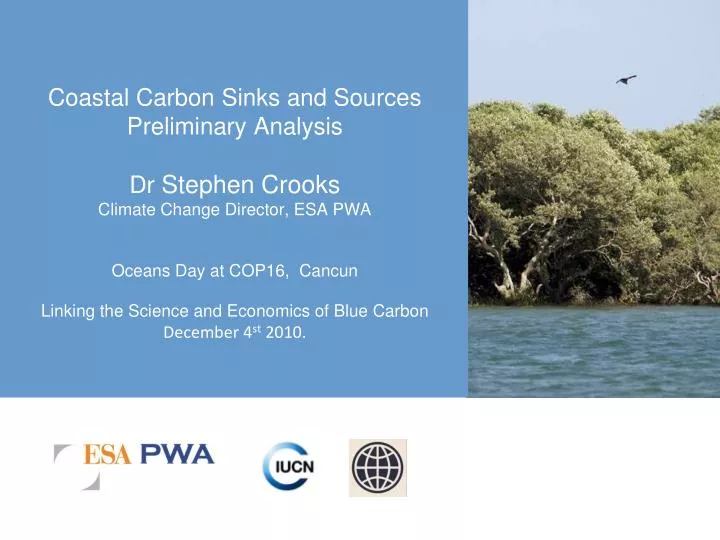
Coastal Carbon Sinks and Sources Preliminary Analysis Dr Stephen Crooks Climate Change Director, ESA PWA Oceans Day at COP16, Cancun Linking the Science and Economics of Blue Carbon December 4 st 2010. High Preservation Potential. Carbon Burial and Ecosystem Area.

E N D
Coastal Carbon Sinks and SourcesPreliminary AnalysisDr Stephen CrooksClimate Change Director, ESA PWAOceans Day at COP16, Cancun Linking the Science and Economics of Blue CarbonDecember 4st 2010.
Drained Wetlands: Very High Emissions Sacramento - San Joaquin Delta
Emissions from One Drained Wetland Area under agriculture 300,000 acres Rate of subsidence (in) 1 inch 10 to 15 million tCO2/yr released from Delta 2 GtCO2 release in c.100 years 4000 years of carbon emitted Equiv. carbon held in 50% of California’s forests
Unaccounted CO2 Emissions from Drained Wetlands Worldwide 0.3 GtCO2 >10GtCO2? 1.4 GtCO2
CO2 Emissions from Drained Wetlands (Preliminary Estimates)
Estimates of Coastal Carbon Pool Size Emissions: 0.1 - 0.25 MtCO2 / km2 / meter depth of soil In peaty wetlands 1 m soils may be lost in >2 decades after drainage Global tidal marsh and mangrove sink at risk: 200 - 600 GtCO2
Conclusions • Coastal wetlands hold dense stores of carbon. • Wetlands emit large quantities of CO2 directly to the atmosphere when drained. • Emissions from drained wetlands highest in first few year. Organic soils continue to lose carbon. • Organic rich soils may release centuries to millennia of carbon within a few decades. • Carbon emissions are readily quantifiable. • Emissions from seagrass beds may also be significant but we know less of the quantity and fate of carbon released.
Stephen Crooks Climate Change Director, ESA PWA s.crooks@pwa-ltd.com 415 262 2300
Peat Accumulation with Sea Level Rise McKee & Vervaeke, 2009
Subsidence Reversal and Carbon Sequestration Net Sequestration: 62 tCO2/ ha/yr Sequest: 44 tCO2 / ha / yr Emission: 18 tCO2 / ha / yr
Large-scale Open boundary Emissions Wetland loss: 100 km2 /yr If top 50 cm erodes then 0.3 GtCO2 /yr Released into circulation But what is its fate???
Relationship between watertable depth and CO2 emissions through peat decomposition Hooijer et al., 2010
Rates of wetland loss Emissions: 0.25 MtCO2 / km2 / meter depth of soil In peaty wetlands 1 m soils may be lost in >2 decades after drainage
Subsidence of Drained Wetlands: Malaysia Average rate of subsidence per year