Download
1 / 1

E N D
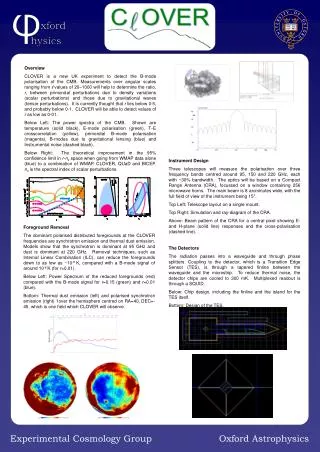
Overview CLOVER is a new UK experiment to detect the B-mode polarisation of the CMB. Measurements over angular scales ranging from l values of 20–1000 will help to determine the ratio, r, between primordial perturbations due to density variations (scalar perturbations) and those due to gravitational waves (tensor perturbations). It is currently thought that r lies below 0·5, and probably below 0·1. CLOVER will be able to detect values of r as low as 0·01. Below Left: The power spectra of the CMB. Shown are temperature (solid black), E-mode polarisation (green), T–Ecrosscorrelation (yellow), primordial B-mode polarisation (magenta), B-modes due to gravitational lensing (blue) and Instrumental noise (dashed black). Below Right: The theoretical improvement in the 95% confidence limit in r-ns space when going from WMAP data alone (blue) to a combination of WMAP. CLOVER, QUaD and BICEP. ns is the spectral index of scalar perturbations. Instrument Design Three telescopes will measure the polarisation over three frequency bands centred around 95, 150 and 220 GHz, each with ~30% bandwidth. The optics will be based on a Compact Range Antenna (CRA), focussed on a window containing 256 microwave horns. The main beam is 8 arcminutes wide, with the full field of view of the instrument being 15°. Top Left: Telescope layout on a single mount. Top Right: Simulation and ray-diagram of the CRA. Above: Beam pattern of the CRA for a central pixel showing E- and H-plane (solid line) responses and the cross-polarisation (dashed line). The Detectors The radiation passes into a waveguide and through phase splitters. Coupling to the detector, which is a Transition Edge Sensor (TES), is through a tapered finline between the waveguide and the microstrip. To reduce thermal noise, the detector chips are cooled to 300 mK. Multiplexed readout is through a SQUID. Below: Chip design, including the finline and the island for the TES itself. Bottom: Design of the TES. Foreground Removal The dominant polarised distributed foregrounds at the CLOVER frequencies are synchrotron emission and thermal dust emission. Models show that the synchrotron is dominant at 95 GHz and dust is dominant at 220 GHz. Removal techniques, such as Internal Linear Combination (ILC), can reduce the foregrounds down to as low as ~10-8 K, compared with a B-mode signal of around 10-6 K (for r=0.01). Below Left: Power Spectrum of the reduced foregrounds (red) compared with the B-mode signal for r=0.15 (green) and r=0.01 (blue). Bottom: Thermal dust emission (left) and polarised synchrotron emission (right) 1over the hemisphere centred on RA=40, DEC=-45, which is one field which CLOVER will observe.


