Download
1 / 45
450 likes | 587 Views
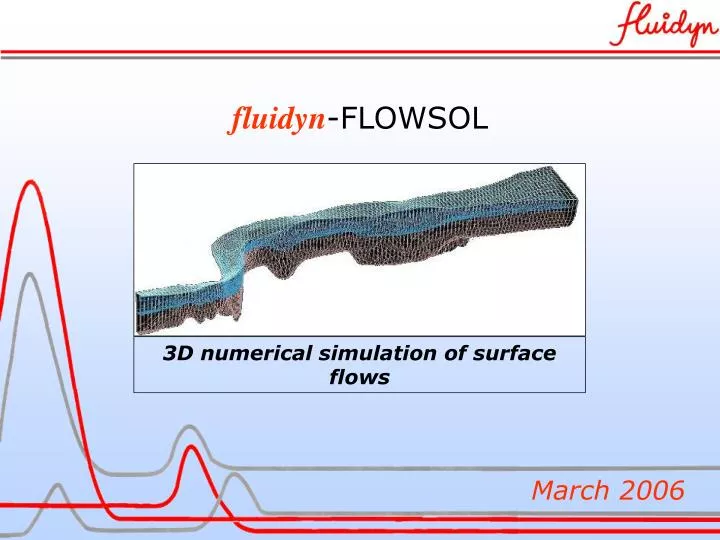
fluidyn -FLOWSOL. 3D numerical simulation of surface flows. March 2006. Introduction. Water quality : environment protection water distribution industrial emissions Accidental pollution increase Numerical simulation of pollutant species in rivers and seas.

E N D
fluidyn-FLOWSOL 3D numerical simulation of surface flows March 2006
Introduction • Water quality : environment protection water distribution industrial emissions • Accidental pollution increase • Numerical simulation of pollutant species in rivers and seas fluidyn-FLOWCOAST
2 Modules fluidyn-FLOWOIL Oil (non-miscible) pollution fluidyn-FLOWPOL Miscible pollution fluidyn-FLOWCOAST
Numerical model • Based on CFD : Navier Stokes 3D equations • Mixing and stratification in near and far fields. • Transient phenomena (tides) • Degrading down to 1D or 2D possible fluidyn-FLOWCOAST
Features • Interactive generation of bathymetry • Automatic generation of curvilinear mesh • Transient boundary conditions (water levels and flow rates) • Effects of wind, dissolution, evaporation • Pollutant transport and dispersion • Density variation (Boussinesq), salinity, temperature • stratification (thermal plumes). • Chemical database • Islands and obstacles (bridges, dams, etc). fluidyn-FLOWCOAST
Features SOLVER INPUT OUTPUT Mesh Model creation Currents Emission Inventory Pollutant maps Currents study Transport Dispersion (Navier-Stokes) Concentration evolution Terrain data fluidyn-FLOWCOAST
Input data • Bathymetry (linear and transverse sections). • Roughness (based on Manning coefficient). • Slope. • Upstream and downstream hydraulic conditions (water • and height). • Emission data (time, mass…variable with respect to time) • Product characteristics (density, lifetime, diffusion • coefficients). fluidyn-FLOWCOAST
Application examples fluidyn-FLOWOIL Simulation of an oil slick in the Tamise estuary fluidyn-FLOWCOAST
Case description • The main objective of this study is to analyze the • environmental consequences of a crude petrol leak in the • Tamise. • The leak is accidental and due to a canalization rupture in • a Tanker • The source is situated near a river bank • The flow in the Tamise estuary is influenced by the tide • cycles fluidyn-FLOWCOAST
Study domain Bathymetric Contours fluidyn-FLOWCOAST
Numerical Model of the terrain fluidyn-FLOWCOAST
Bathymetric contours fluidyn-FLOWCOAST
Terrain and Flow data • The maximum depth reached in the estuary is 14.8 m. • The bathymetric bottom is sandy with a D50 of 1.5 mm. • The Manning roughness coefficient is taken at 0.1. • The flow boundary conditions are unsteady and variable • with respect to the tide cycles fluidyn-FLOWCOAST
Emission data • Fluid : Crude • Quantity : 1000 tons • Fluid density : 900 Kg/m3 (at 150 C) • Kinetic viscosity : 0.00134 m2/s • Ambient air temperature : 13 °C • Lifetime • The product source is a pipeline of diameter 40 cm fluidyn-FLOWCOAST
3D Mesh fluidyn-FLOWCOAST
Study of currents Velocity Vectors (m/s) 0.223 0 0.446 Surface velocity vectors after 1 hour fluidyn-FLOWCOAST
Study of currents Velocity Vectors (m/s) 0.389 0 0.778 Surface velocity vectors after 2 hours fluidyn-FLOWCOAST
Study of currents Velocity Vectors (m/s) 0.371 0 0.742 Surface velocity vectors after 4 hours fluidyn-FLOWCOAST
Study of currents Velocity Vectors (m/s) 0.277 0 0.555 Surface velocity vectors after 6 hours fluidyn-FLOWCOAST
Study of currents Velocity Vectors (m/s) 0.642 0 1.285 Surface velocity vectors after 8 hours fluidyn-FLOWCOAST
Dispersion Oil Concentration (kg/m3) 0 56.0 112.0 Concentration after 2 hours fluidyn-FLOWCOAST
Dispersion Oil Concentration (kg/m3) 47.8 0 23.9 Concentration after 4 hours fluidyn-FLOWCOAST
Dispersion Oil Concentration (kg/m3) 45.57 0 22.78 Concentration after 6 hours fluidyn-FLOWCOAST
Dispersion Oil Concentration (kg/m3) 21.98 0 10.99 Concentration after 8 hours fluidyn-FLOWCOAST
Example fluidyn-FLOWPOL Dispersion of pollutant layer in the river Seine fluidyn-FLOWCOAST
Case description • Linear hydrocarbons over 5 km. • Presence of an island. • Injection of 21.54 kg of Rhodamine during 57 min. • Expected results: • transport time • distribution between the two arms of the river • evolution of transversal distribution in course of time fluidyn-FLOWCOAST
Domain and bathymetry Bathymetry generation from 10 cross profiles fluidyn-FLOWCOAST
3D Mesh 100 grids lengthwise, 15 width wise, 6 in depth. Unrefined structured curvilinear mesh fluidyn-FLOWCOAST
Study of currents Between the injection point and the island: no curvatures or major bathymetric variations : relatively invariant hydrological fields. From the island tip : brusque variation in bathymetry: influences the tracer distribution. fluidyn-FLOWCOAST
Dispersion Concentration after 2 and 6 hours fluidyn-FLOWCOAST
Dispersion Concentration after 8 and 10 hours fluidyn-FLOWCOAST
Example fluidyn-FLOWPOL Dispersion of industrial effluents in the Seine fluidyn-FLOWCOAST
Context • Industrial effluent discharge in Seine waters • Designing an immersed diffuser (type of emission) to limit the effluent concentration in the Seine fluidyn-FLOWCOAST
Methodology 3D numerical modeling of flow in Seine Addition of emission sources (diffusers) Monitoring effluent concentrations Selection of diffuser to install fluidyn-FLOWCOAST
Geometry Geometry / bathymetry construction from IGN map and the cross profiles of the Seine over the selected zone (28 along the plot) fluidyn-FLOWCOAST
Mesh • 3D curvilinear, unstructured mesh in order to conform to the bathymetry • Fine mesh at emission source level Input section mesh (upstream limit) Output section mesh (downstream limit) fluidyn-FLOWCOAST
Mesh Surface mesh fluidyn-FLOWCOAST
Hydraulic data Modeling 2 currentology situations fluidyn-FLOWCOAST
Study of currents Surface velocity fields(m/s) Velocity fields (m/s) at river bed fluidyn-FLOWCOAST
Study of currents Velocity fields (m/s) at the inlet Velocity fields (m/s) at outlet fluidyn-FLOWCOAST
Emission Data Many outlet types and positions possible fluidyn-FLOWCOAST
Emission data fluidyn-FLOWCOAST
Dispersion results Surface concentration contours in mg/l Outlet concentration contours in mg/l fluidyn-FLOWCOAST
Dispersion results Concentration iso-surface in mg/l fluidyn-FLOWCOAST
FOR MORE INFORMATION…. http://www.fluidyn.com contact@fluidyn.com