Download
1 / 11
140 likes | 336 Views
Case Study Title. Student Name(s) Period ____. Statement of Purpose. The purpose of this presentation is to… Presentation Hint: Always use clear fonts, with dark colors and backgrounds with light colors to make reading at a distance easy. Definitions/Description.

E N D
Case Study Title Student Name(s)Period ____
Statement of Purpose The purpose of this presentation is to… • Presentation Hint: Always use clear fonts, with dark colors and backgrounds with light colors to make reading at a distance easy.
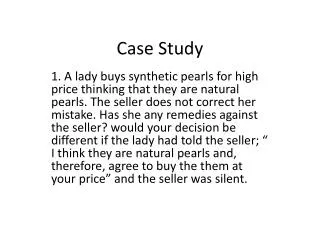
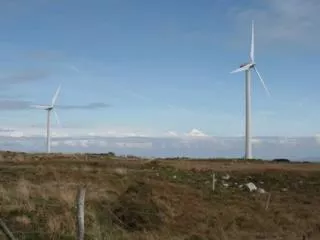
Definitions/Description • Include a description of your topic and any important definitions needed to understand your research. • Examples: urban runoff, wattage, green roof, pollution
Compare/Contrast • Disadvantages vs. advantages • Benefits vs. drawbacks • Pros vs. cons • Etc. • Presentation Hint: When using images, make sure it’s relevant to your topic and that you cite where it came from.
Experimental Data • Feel free to copy and paste the pre-made tables from your packets into the powerpoint. Use the course website to get a digital copy of your packet.
Graph Title Goes Here Label 2 (units) Label 1 (units)
Data Analysis • After the experiment is over, use this slide to summarize patterns in your data or any conclusions you came to while reviewing data. • Patterns of consistent numbers. • Explain highs and lows. • Relate to purpose.
Data Analysis continued • Green roof groups- Remember to say we shut the lights off after 15 minutes and why you think the green roof continued to go up for a little while. • Runoff groups– Mention the rate of the poured water and how it relates to percentage absorbed. Ex. Did the absorption rate increase or decrease with the rate? • Light bulb groups – Be sure to mention the efficiency of a bulb is related to how much energy it uses (watts) vs. how much heat it puts out. Ex. The higher the temperature measured and watts used, the less efficient it is. Which one is the best, which is the worst? How much money will you save using it?
Conclusion • Summarize the entire project and wrap-up.
Works Cited(these are just examples!) Images: • http://www.images.org Background Information: • http://www.backgroundinformation.gov • Presentation Hint: Unless otherwise directed, only use websites with the endings: .gov, .org, or .edu AVOID: .com and .net


![[Title] Business Case](https://cdn3.slideserve.com/6965678/title-business-case-dt.jpg)