Download
1 / 60
600 likes | 608 Views
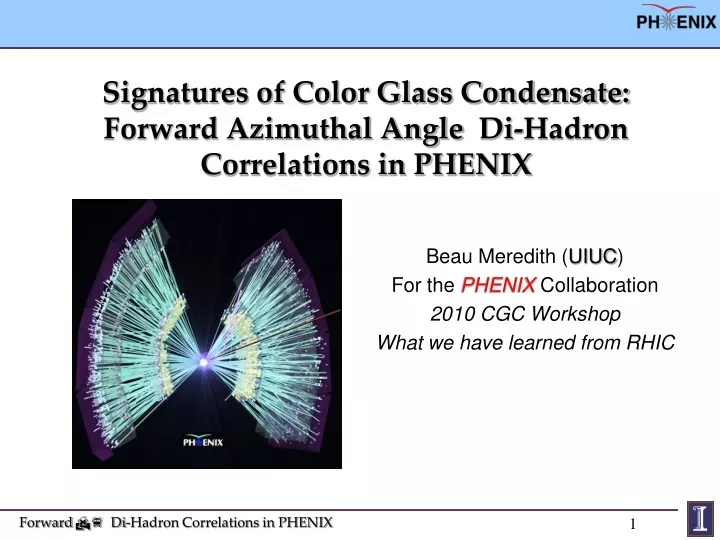
Signatures of Color Glass Condensate: Forward Azimuthal Angle Di-Hadron Correlations in PHENIX. Beau Meredith ( UIUC ) For the PHENIX Collaboration 2010 CGC Workshop What we have learned from RHIC. Outline. Theory Motivation PHENIX Detector Subsystems

E N D
Signatures of Color Glass Condensate: Forward Azimuthal AngleDi-Hadron Correlations in PHENIX Beau Meredith (UIUC) For the PHENIX Collaboration 2010 CGC Workshop What we have learned from RHIC
Outline • Theory Motivation • PHENIX Detector Subsystems • Two-particle Correlation Measurements • Results and Interpretation • Published RHIC Run3 d+Au • New RHIC Run8 d+Au • Outlook
The Color Glass Condensate See Yu.V. Kovchegov, Phys. Rev. D 61, 074018 (2000). For review, see F. Gelis, E. Iancu, J. Jalilian- Marian, R. Venugopalan, arXiv:1002.0333 gluon density saturates for large densities at small x : Non-linear evolution eqn. diffusion g-g merging g emission • g-g merging large if • saturation scale, Qs • nuclear enhancement ~ A1/3 • increasing gluon density~ 1/xl Mechanism for gluon saturation
CGC Effects at RHIC ( = 200 GeV) pT is balanced by many gluons dilute parton system, deuteron dense gluon field , Au Gluon distribution function from HERA • Probe low x gluons at forward rapidities • Usedeuteron-gold (d+Au) collisions vs p+p • Difference is nuclear enhancement factor in saturation scale, A1/3 • Signatures of CGC • suppression of nuclear modification factors • angular decorrelations of di-jet signals (di-hadron Df correlations) • Disappearance of the away-side peak in when Q2 ~ Qs2 F.D. Aaron et al, [H1 Collaboration] Eur. Phys. J. C 64, 561 (2009)
Outline • Theory Motivation • PHENIX Detector Subsystems • Two-particle Correlation Measurements • Results and Interpretation • Published RHIC Run3 d+Au • New RHIC Run8 d+Au • Outlook
PHENIX Detector at RHIC • Central Arms | η | < 0.35 • Charged hadrons • Neutral pions / η • Heavy Flavor electrons • Direct Photon • J/Psi • Muon Arms 1.2 < | η | < 2.4 • Unidentified charged hadrons • Heavy Flavor muons • J/Psi • Muon Piston Calorimeter • 3.1 < | η | < 3.9 • Neutral pions / η
PHENIX Muon Piston Calorimeter PbWO4 Density 8.28 g/cm3 Size 2.2x2.2x18 cm3 Length 20 X0, 0.92 Weight 721.3 g SOUTH NORTH Moliere radius 2.0 cm Radiation Length 0.89 cm Interaction Length 22.4 cm Light Yield ~10 p.e./MeV @ 25 C Temp. Coefficient -2% / C Radiation Hardness 1000 Gy Main Emission Lines 420-440, 500 nm Refractive Index 2.16 Small cylindrical hole in Muon Magnet Piston, Radius 22.5 cm and Depth 43.1 cm
MPC MPC • MPCs installed in 2005-2006 • Increase PHENIX acceptance for calorimetry by a factor of 4 (with a detector more than 10 times smaller) PHENIX Acceptance South Muon Tracker North Muon Tracker EMCAL + Central Tracker 0 f coverage 2p EMCAL + Central Tracker -3 -2 -1 0 1 2 3 rapidity
Forward Muon Piston Calorimeters p0 ID up to E ~ 20 GeV with MPCs (3.1 < |h| < 3.9) Limitations: tower separation and merging effects Use p0s for 7 GeV < E < 22 GeV pT max ~ 2 GeV/c Use event mixing to subtract bg Single Clusters for E > 15 GeV Dominated by p0 (~ 85%) Access higher pT Merged p0gg p0gg 11 < E < 15 Foreground Event Mixed Background Yield Mgg (GeV/c2) North MPC
Outline • Theory Motivation • PHENIX Detector Subsystems • Two-particle Correlation Measurements • Results and Interpretation • Published RHIC Run3 d+Au • New RHIC Run8 d+Au • Outlook
Azimuthal Angular Correlations • Measure Df of all particle pairs • Define trigger particle (basically the leading pTparticle – indicates jet) and associate particle (lower pT) trigger Beam view Df associate • Signals of saturation are suppression and/or broadening of away-side peak in d+Au relative to p+p • p+p, d+AuCentral rapidity correlations are similar (RHIC Run3) Dh=0 is similar for d+Au (closed) and p+p (open) Near-side Away-side S.S Adler et al, Phys. Rev. C 73:054903,2006.
Forward Rapidity Correlations • Use PHENIX forward detectors • New results from RHIC run8sNN= 200 GeV • d+Au (Lint=80 nb-1) • p+p (Lint=5.2 pb-1) from RHIC Run8 • Measure two sets of different angular correlations • Rapidity-separated (forward/central) • Predicted to be sensitive to saturation effects in d+Au • Both particles forward (forward/forward) • Lowest x (strongest test for saturation in d+Au) p+p, Dh=3.4 D. Kharzeev, E. Levin, L. McLerran, Nucl.Phys.A748:627-640,2005 Df
How do we Quantify Suppression? • “ConditionalYield” • Number of di-jet particle pairsper trigger particle • Possible indicators of gluon saturation • IdA < 1 • Angular decorrelation of widths Peripheral d+Au Correlation Function Acceptance x efficiency Npair Nuclear Modification factor Df
Outline • Theory Motivation • PHENIX Detector Subsystems • Two-particle Correlation Measurements • Results and Interpretation • Published RHIC Run3 d+Au • New RHIC Run8 d+Au • Outlook
IdA from the PHENIX Muon Arms Observations at PHENIX using the 2003 d+Au sample: Left: IdA for hadrons1.4 < |h| < 2.0 , PHENIX muon arms. correlated with h+/- in |h| < 0.35, central arms. Right: Comparison of conditional yields with different trigger particle pseudo-rapidities and different collision centralities No significant suppression or widening seen within large uncertainties! pTa, h+/- pTt, hadron 0-40% centrality 40-88% centrality IdA Trigger pT range IdA pTassociated Phys.Rev.Lett. 96 (2006) 222301
Outline • Theory Motivation • PHENIX Detector Subsystems • Two-particle Correlation Measurements • Results and Interpretation • Published RHIC Run3 d+Au • New RHIC Run8 d+Au • Outlook
sNN= 200 GeV d+Au Collision d Au PHENIX central spectrometer magnet Muon Piston Calorimeter (MPC) Forward direction (North) Backward direction (South) Side View
sNN= 200 GeV d+Au Collision PHENIX central spectrometer magnet Muon Piston Calorimeter (MPC) d Au Forward direction (North) Backward direction (South) Side View
Forward Di-jet Signal with Dh = 3.4 Mostly Merged p0s PHENIX central spectrometer magnet Muon Piston Calorimeter (MPC) p0 or clusters xgluon ~ 10-2 Nuclear enhancement Au effective xgluon ~ 10-3 Forward direction (North) Backward direction (South) p0 or h+/- Side View
p0 (trigger,central)/p0 (associate,forward) <pTa>=0.55 GeV/c <pTa>=0.77 GeV/c <pTa>=1.00 GeV/c 2.0 < pTt < 3.0 GeV/c pp dAu 0-20% Correlation Function dAu 60-88% pTt, p0 pTa,p0 Df
p0 (trigger,central)/cluster (associate,forward) <pTa>=1.09 GeV/c <pTa>=2.00 GeV/c <pTa>=3.10 GeV/c 2.0 < pTt < 3.0 GeV/c pp dAu 0-20% Correlation Function dAu 60-88% pTt, p0 pTa,p0 Df
Dh = 3.4 Correlations: Widths • No significant broadening between p+p and d+Au within large experimental uncertainties Trigger p0: |h| < 0.35,3.0 < pT < 5.0 GeV/c Trigger p0: |h| < 0.35,2.0 < pT < 3.0 GeV/c • p+p • d+Au 0-20 • d+Au 40-88 Two Cluster p0 (closed) Single Cluster (open) dAu 0-20% pp dAu 40-88%
Dh = 3.4 Correlations: IdA Associate p0: 3.1 < h< 3.9, 0.45 < pT < 1.59 GeV/c • IdA for central triggered events for reconstructed p0 • Increasing suppression of IdA reaches a factor 2 for central events • Indicates di-jet suppression
sNN= 200 GeV d+Au Collision PHENIX central spectrometer magnet Muon Piston Calorimeter (MPC) d Au Forward direction (North) Backward direction (South) Side View
sNN= 200 GeV d+Au Collision PHENIX central spectrometer magnet Muon Piston Calorimeter (MPC) d Au Forward direction (North) Backward direction (South) Side View
Forward Di-jet Signal with htrig, hassoc = 3.4 Mostly Merged p0s PHENIX central spectrometer magnet Muon Piston Calorimeter (MPC) p0 xgluon ~ 10-3 Nuclear enhancement Au effective xgluon ~ 10-4 clusters Forward direction (North) Backward direction (South) Side View
Forward/Forward Correlations: p+p Trigger particle pT > 2 GeV/c Associate particle pT > 0.875 GeV/c Data points mirrored for Df > p Systematic errors: subtract contributions to angular correlations from invariant mass background underneath p0 peak (see red curve on right) • Show per-trigger correlation functions, i.e. 1/NtrigdN/d(Df) • Area of away-side peak represents conditional yield without efficiency correction • More work needed to determine uncorrelated background level • Conditional yields, widths not shown trigclusterh = 3.4 assoc p0, h = 3.4
p+p vs d+Au MinBias Trigger particle pT > 2 GeV/c Associate particle pT > 0.875 GeV/c Data qualitatively indicates angular decorrelation of d+Au compared to p+p
p+p vs d+Au MinBias (a closer look) Shift minimum y-values to 0 (for comparison only) Data qualitatively indicates angular decorrelation of d+Au compared to p+p It also appears that there is a suppressed conditional yield in d+Au vs. p+p
p+p vs d+Au Central Decorrelation and/or suppression seem to get stronger for central d+Au collisions Beam view of d+Au central collision
p+p vs d+Au Peripheral Peripheral d+Au collisions are more similar to p+p collisions Beam view of d+Au peripheral collision
Comparison to STAR Data d+Au min bias d+Au central p+p p+p p+p d+Au min bias d+Au central
pT Dependence • Next, we show the pT dependence of the correlation functions • pT,trig > 1.0 GeV/c pT,trig > 2.0 GeV/c • pT,assoc > 0.5 GeV/c pT,assoc > 1.0 GeV/c (upper limit due to merging effects is set at 2 GeV/c, but varies with rapidity) • The plots shown have the minimum y-points shifted to 0
d+Au Peripheral, p+p Correlation Functions pT,trig 1.0 GeV/c 2.0 GeV/c 0.5 GeV/c p+p and d+Au peripheral are very similar pT,assoc Beam view of d+Au periph. collision 1.0 GeV/c
d+Au MinBias, p+p Correlation Functions pT,trig 1.0 GeV/c 2.0 GeV/c 0.5 GeV/c d+Au minbias shows signs of suppression pT,assoc 1.0 GeV/c
d+Au Central, p+p Correlation Functions pT,trig 1.0 GeV/c 2.0 GeV/c 0.5 GeV/c d+Au central appears to show disappearance of away-side peak pT,assoc Beam view of d+Au central collision 1.0 GeV/c
Summary & Outlook • Summary of Measurements • Rapidity separated forward/central correlations (Dh = 3.4; trigger particle is at central rapidities) • No significant broadening between d+Au vs pp within experimental precision • Suppression of IdA is observed as one goes to more central collisions, indicating di-jet suppression • Forward/forward correlations (htrig,assoc = 3.1-3.8) • Data seems qualitatively consistent with gluon saturation hypothesis that the d+Au yields are suppressed relative to p+p • Some of the data also suggest that the widths in d+Au are broadened • Need more work on uncorrelated background before making quantitative statements • Future Plans • Determine background, widths, and yields in forward/forward correlations • Apply acceptance x efficiency correction
d+Au Peripheral, p+p Correlation Functions pT,trig 1.0 GeV/c 2.0 GeV/c 0.5 GeV/c pT,assoc Beam view of d+Au periph. collision 1.0 GeV/c
d+Au MinBias, p+p Correlation Functions pT,trig 1.0 GeV/c 2.0 GeV/c 0.5 GeV/c pT,assoc 1.0 GeV/c
d+Au Central, p+p Correlation Functions pT,trig 1.0 GeV/c 2.0 GeV/c 0.5 GeV/c pT,assoc Beam view of d+Au central collision 1.0 GeV/c
IdA vs JdA: Can we decouple effects? • IdA is the per trigger comparison of d+Au jet associated counts relative to p+p • JdA is the rate of the associated pairs from a jet (per minbias event) • Can we use this to tell if the jets are modified, or do they disappear? • From the CNT-MPC corrrelations, we get IdA ~ 0.5, and RdA ~ 1.1 • JdA ~ 0.5 • The rate of correlated pairs is about half of p+p • Does this imply that the missing jets have disappeared, and not that they are modified, since IdA ~ JdA? • But not true for STAR FMS triggered-central barrel, where IdA ~ 1 and JdA ~ 0.5
MPC Invariant Mass Peaks d+Au 0-20 d+Au 60-88 p+p 9 GeV < E < 17 GeV pT > 0.75 GeV/c
Experimental Method: Overview • Using azimuthal angle (transverse direction) two-particle correlations • d+Au (Lint=80 nb-1), pp (Lint=5.2 pb-1) collisions at sNN= 200 GeV from RHIC Run8 • Trigger particles are (p0, h+/-) with |h| < 0.35 • Associate particles are forwardp0s and clusters with 3.1 < h < 3.9 • Probes gluon distribution at moderately low x • Signal of saturation is suppression/broadening of away-side peak in d+Au relative to p+p Example Correlation Function for rapidity separated particles Central Rapidity Spectrometer Forward EMC π0 π0 3.1 < η < 3.9 x-range in Au: 0.006 < x < 0.1 Df From calculation by Marco Stratmann
Correlation Functions for central arm/MPC Central Rapidity Spectrometer Forward MPC π0 π0 3.1 < η < 3.9
p0 (trigger,central)/p0 (associate,forward) <pTa>=0.55 GeV/c <pTa>=0.77 GeV/c <pTa>=1.00 GeV/c 2.0 < pTt < 3.0 GeV/c for all plots pp Correlation Function dAu 0-20% dAu 60-88% pTt, p0 Df pTa, p0
p0 (trigger,central)/p0 (associate,forward) <pTa>=0.55 GeV/c <pTa>=0.77 GeV/c <pTa>=1.00 GeV/c 3.0 < pTt < 5.0 GeV/c for all plots pp Correlation Function dAu 0-20% dAu 60-88% pTt, p0 Df pTa, p0
h+/- (trigger,central)/p0 (associate,forward) <pTa>=0.55 GeV/c <pTa>=0.77 GeV/c <pTa>=1.00 GeV/c 1.0 < pTt < 2.0 GeV/c for all plots pp Correlation Function dAu 0-20% dAu 60-88% pTt, h+/- Df pTa, p0
p0 (trigger,central)/cluster (associate,forward) <pTa>=1.09 GeV/c <pTa>=2.00 GeV/c <pTa>=3.10 GeV/c 2.0 < pTt < 3.0 GeV/c for all plots pp Correlation Function dAu 0-20% dAu 60-88% pTt, p0 Df pTa, cluster