Download

1 / 39
400 likes | 643 Views
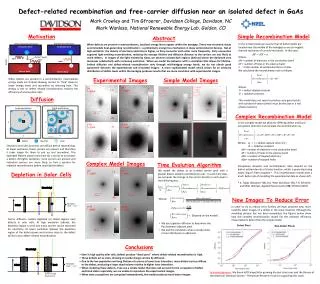
Modeling defect level occupation for recombination statistics. Adam Topaz and Tim Gfroerer Davidson College Mark Wanlass National Renewable Energy Lab Supported by the American Chemical Society – Petroleum Research Fund. A semiconductor:. Conduction Band. Defect States. Energy.

E N D
Modeling defect level occupation for recombination statistics Adam Topaz and Tim Gfroerer Davidson College Mark Wanlass National Renewable Energy Lab Supported by the American Chemical Society – Petroleum Research Fund
A semiconductor: Conduction Band Defect States Energy Valence Band
Equilibrium Occupation in a Low Temperature Semiconductor. Holes Electron Trap Hole Trap Electrons
Photoexcitation Photon
Photoexcitation Photon
Photon Radiative Recombination.
Photon Radiative Recombination.
Heat Defect Related Recombination.
Heat Defect Related Recombination.
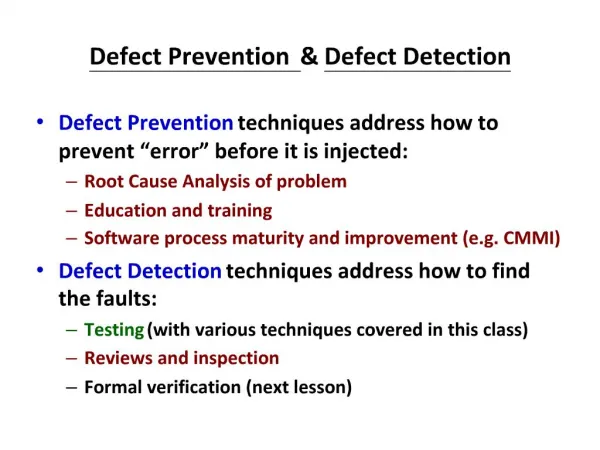
What do we measure? • Recombination rate includes radiative and defect-related recombination. • Measurements were taken of radiative efficiency vs. recombination rate. • (radRate)/(radRate+defRate) vs. (radRate + defRate) • Objective: Information about the defect-relateddensity of states.
The Defect-Related Density of States (DOS) Function Conduction Band Defect States Energy Ev Ec Energy Valence Band
Band Density Of States Conduction Band Valence Band Energy Energy
Calculate x-Axis Use Rate value for y-Axis • dP = hole concentration in valence band • dN = electron concentration in conduction band
The simple theory… • Assumptions: • dP = dN = n • Defect states located near the middle of the gap • No thermal excitation into bands. • Fitting the simple theory: • radB is given. • Find defA to minimize logarithmic error • defA is the defect related recombination constant • radB is the radiative recombination constant.
A Better Model… • Assumptions: • defA independent of temperature (and is related to the carrier lifetime) • Calculations: • Calculate Ef for a given temperature, bandgap and defect distribution • Calculate QEfp / QEfn for a given exN (the value of exN is chosen to match experimental dPdN) • Calculate occupations (dP, dN, dDp, and dDn) • dDp = trapped hole concentration • dDn = trapped electron concentration • Ef is the Fermi energy • QEFp/n is the quasi-Fermi energy for holes and electrons respectively • exN is the number of excited carriers
Calculating Ef… • The Fermi energy Ef is the energy where: • (# empty states below Ef) = (# filled states above Ef) • Red area = Blue area Ef Valence Band Defect States Conduction Band Energy
Calculating QEFp and QEFn… • Find QEFp and QEFn such that: • exN = increased occupation (red area) Increased hole occupation Increased electron occupation Ef Ef QEFn QEFp Filled Hole States Filled Electron States exN exN Energy Energy
Calculating band occupations… • dP and dN depend on QEFp and QEFn, respectively. QEFp QEFn Conduction Band Valence Band dN dP Energy Energy
Calculating defect occupation… • dDp and dDn depend on Ef, and QEF’s Trapped hole occupation Trapped electron occupation Ef Ef QEFn QEFp Electron Traps dDn dDp Hole Traps Energy Energy Note: graph represents an arbitrary midgap defect distribution
Symmetric vs. Asymmetric defect distribution… • Symmetric Defect DOS: Ev Ec
Asymmetric defect DOS… • Using 2 Gaussians…(fit for 2 Gaussians) Ev Ec
Conclusion… • Simple Theory Defect slope is too steep and theory does not allow for temperature dependence! • Temperature dependence and shallow defect slope can be modeled using: • An occupation model that allows for thermal defect-to-band excitation. • An asymmetric defect level distribution
In-depth look at the model… • Calculating DOS(e) • DOS(e) = ValenceBand(e) + ConductionBand(e) + defDos(e) • ValenceBand(e) = 0 if e > Ev, if e >= Ev • ConductionBand(e) = 0 if e < Ec, if e <= Ec • defDos(e) is an arbitrary function denoting the defect density of states. defDos(e) = 0 when e <= Ev or e >= Ec
Fermi Function, and calculating Ef… • Fermi Function: • To calculate Ef, find Ef where:
Calculating QEFp/n • QEFp denotes the point where: • QEFn denotes the point where:
Calculating Occupations… Note: see slide 7 for rate value.
Numerical Infinite Integrals… • Need: a bijection • And • Then: • Using ArcTan,