Download
1 / 1
10 likes | 146 Views
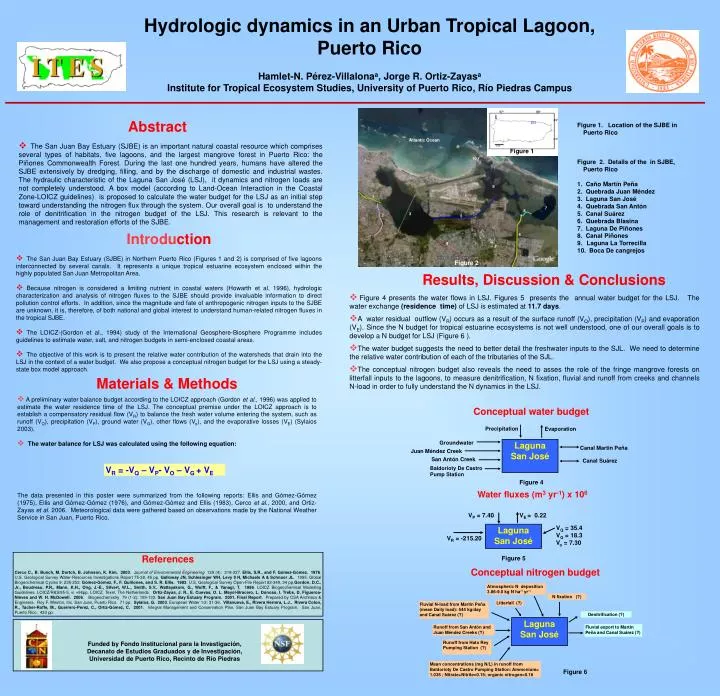
Atlantic Ocean. 1. 10. 9. 1. 7. 8. 3. 2. 5. 6. 4. Precipitation. Evaporation. Figure 4. Groundwater. Laguna San José. V P = 7.40. V E = 0.22. Canal Martin Peña. Juan Méndez Creek. Laguna San José. V Q = 35.4 V G = 18.3 V o = 7.30. San Antón Creek. Canal Suárez.

E N D
Atlantic Ocean 1 10 9 1 7 8 3 2 5 6 4 Precipitation Evaporation Figure 4 Groundwater Laguna San José VP = 7.40 • VE = 0.22 Canal Martin Peña Juan Méndez Creek Laguna San José VQ = 35.4 VG = 18.3 Vo = 7.30 San Antón Creek Canal Suárez VR = -215.20 Baldorioty De Castro Pump Station Figure 5 Atmospheric N deposition 3.86-9.0 kg N ha-1 yr-1 N fixation (?) Litterfall (?) Fluvial N-load from Martín Peña (mean Daily load): 544 kg/day and Canal Suárez (?) Denitrification (?) Laguna San José Runoff from San Antón and Juan Méndez Creeks (?) Fluvial export to Martín Peña and Canal Suárez (?) Runoff from Hato Rey Pumping Station (?) Mean concentrations (mg N/L) in runoff from Baldorioty De Castro Pumping Station: Ammonium= 1.035 ; Nitrate+Nitrite=0.15; organic nitrogen=0.16 Figure 6 Hydrologic dynamics in an Urban Tropical Lagoon, Puerto Rico Hamlet-N. Pérez-Villalonaa, Jorge R. Ortiz-Zayasa Institute for Tropical Ecosystem Studies, University of Puerto Rico, Río Piedras Campus Abstract • Figure 1. Location of the SJBE in Puerto Rico • Figure 2. Details of the in SJBE, Puerto Rico • 1. Caño Martín Peña • 2. Quebrada Juan Méndez • 3. Laguna San José • 4. Quebrada San Antón • 5. Canal Suárez • 6. Quebrada Blasina • 7. Laguna De Piñones • 8. Canal Piñones • Laguna La Torrecilla • 10. Boca De cangrejos • The San Juan Bay Estuary (SJBE) is an important natural coastal resource which comprises several types of habitats, five lagoons, and the largest mangrove forest in Puerto Rico: the Piñones Commonwealth Forest. During the last one hundred years, humans have altered the SJBE extensively by dredging, filling, and by the discharge of domestic and industrial wastes. The hydraulic characteristic of the Laguna San José (LSJ), it dynamics and nitrogen loads are not completely understood. A box model (according to Land-Ocean Interaction in the Coastal Zone-LOICZ guidelines) is proposed to calculate the water budget for the LSJ as an initial step toward understanding the nitrogen flux through the system. Our overall goal is to understand the role of denitrification in the nitrogen budget of the LSJ. This research is relevant to the management and restoration efforts of the SJBE. Figure 1 • Introduction • The San Juan Bay Estuary (SJBE) in Northern Puerto Rico (Figures 1 and 2) is comprised of five lagoons interconnected by several canals. It represents a unique tropical estuarine ecosystem enclosed within the highly populated San Juan Metropolitan Area. • Because nitrogen is considered a limiting nutrient in coastal waters (Howarth et al. 1996), hydrologic characterization and analysis of nitrogen fluxes to the SJBE should provide invaluable information to direct pollution control efforts. In addition, since the magnitude and fate of anthropogenic nitrogen inputs to the SJBE are unknown, it is, therefore, of both national and global interest to understand human-related nitrogen fluxes in the tropical SJBE. • The LOICZ-(Gordon et al., 1994) study of the International Geosphere-Biosphere Programme includes guidelines to estimate water, salt, and nitrogen budgets in semi-enclosed coastal areas. • The objective of this work is to present the relative water contribution of the watersheds that drain into the LSJ in the context of a water budget. We also propose a conceptual nitrogen budget for the LSJ using a steady-state box model approach. Figure 2 Results, Discussion & Conclusions • Figure 4 presents the water flows in LSJ. Figures 5 presents the annual water budget for the LSJ. The water exchange (residence time) of LSJ is estimated at 11.7 days. • A water residual outflow (VR) occurs as a result of the surface runoff (VQ), precipitation (VP) and evaporation (VE). Since the N budget for tropical estuarine ecosystems is not well understood, one of our overall goals is to develop a N budget for LSJ (Figure 6 ). • The water budget suggests the need to better detail the freshwater inputs to the SJL. We need to determine the relative water contribution of each of the tributaries of the SJL. • The conceptual nitrogen budget also reveals the need to asses the role of the fringe mangrove forests on litterfall inputs to the lagoons, to measure denitrification, N fixation, fluvial and runoff from creeks and channels N-load in order to fully understand the N dynamics in the LSJ. • Materials & Methods • A preliminary water balance budget according to the LOICZ approach (Gordon et al., 1996) was applied to estimate the water residence time of the LSJ. The conceptual premise under the LOICZ approach is to establish a compensatory residual flow (VR) to balance the fresh water volume entering the system, such as runoff (VQ), precipitation (VP), ground water (VG), other flows (Vo), and the evaporative losses (VE) (Sylaios 2003). • The water balance for LSJ was calculated using the following equation: The data presented in this poster were summarized from the following reports: Ellis and Gómez-Gómez (1975), Ellis and Gómez-Gómez (1976), and Gómez-Gómez and Ellis (1983), Cerco et al., 2000, and Ortiz-Zayas et al. 2006. Meteorological data were gathered based on observations made by the National Weather Service in San Juan, Puerto Rico. Conceptual water budget VR = -VQ – VP- VO – VG + VE Water fluxes (m3 yr-1) x 106 References Cerco C., B. Bunch, M. Dortch, B. Johnson, K. Kim. 2003. Journal of Environmental Engineering 129 (4): 318-327. Ellis, S.R., and F. Gómez-Gómez. 1976. U.S. Geological Survey Water-Resources Investigations Report 75-38, 45 pp. Galloway JN, Schlesinger WH, Levy II H, Michaels A & Schnoor JL. 1995. Global Biogeochemical Cycles 9: 235-252. Gómez-Gómez, F., F. Quiñones, and S. R. Ellis. 1983. U.S. Geological Survey Open-File Report 82-349, 34 pp.Gordon, D.C., Jr., Boudreau, P.R., Mann, K.H., Ong, J.-E., Silvert, W.L., Smith, S.V., Wattayakom, G., Wulff, F., & Yanagi, T. 1996. LOICZ Biogeochemical Modelling Guidelines. LOICZ/R&S/95-5, vi +96pp. LOICZ, Texel, The Netherlands.Ortíz-Zayas, J. R., E. Cuevas, O. L. Mayol-Bracero, L. Donoso, I. Trebs, D. Figueroa-Nieves and W. H. McDowell. 2006. Biogeochemistry 79 (1-2): 109-133. San Juan Bay Estuary Program. 2001. Final Report. Prepared by CSA Architecs & Engineers. Roy F. Weston, Inc. San Juan, Puerto Rico. 71 pp. Sylaios, G. 2003. European Water 1/2: 31-36. Villanueva, E., Rivera Herrera, L.J., Rivera Colon, R., Tacher-Roffe, M., Guerrero-Perez, C., Ortiz-Gómez, C. 2001. Integral Management and Conservation Plan. San Juan Bay Estuary Program. San Juan, Puerto Rico. 433 pp. Conceptual nitrogen budget Funded by Fondo Institucional para la Investigación, Decanato de Estudios Graduados y de Investigación, Universidad de Puerto Rico, Recinto de Río Piedras