Download
1 / 21
210 likes | 354 Views
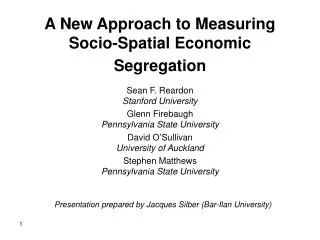
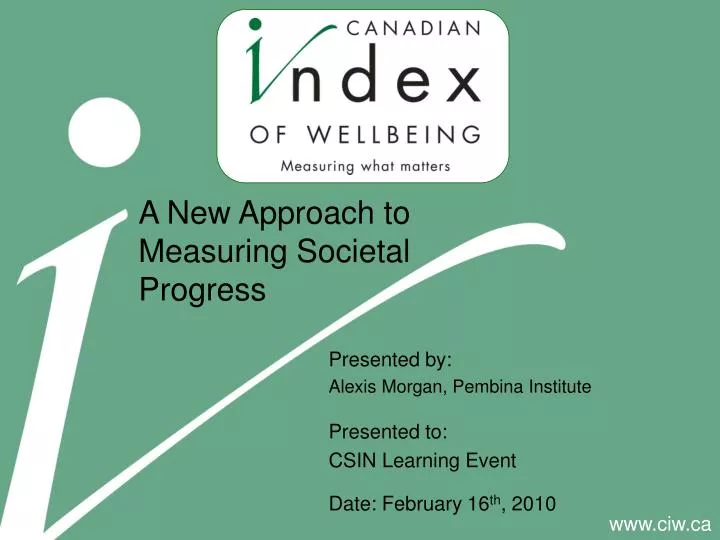
A New Approach to Measuring Societal Progress. Presented by: Alexis Morgan, Pembina Institute. Presented to: CSIN Learning Event Date: February 16 th , 2010 . Outline. What is Wellbeing? What is the Canadian Index of Wellbeing? Why a New Measure of Wellbeing? The Environment Domain

E N D
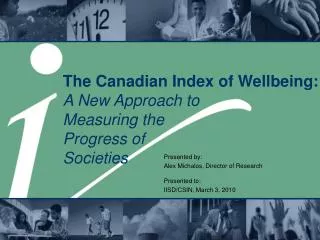
A New Approach to Measuring Societal Progress Presented by: Alexis Morgan, Pembina Institute Presented to: CSIN Learning Event Date: February 16th, 2010
Outline • What is Wellbeing? • What is the Canadian Index of Wellbeing? • Why a New Measure of Wellbeing? • The Environment Domain • Questions
How are we doing as Canadians? “IS THIS WELLBEING?”
“Around the world, a consensus is growing about the need for a more holistic and transparent way to measure societal progress – one that accounts for more than just economic indicators such as the Gross Domestic Product and takes into account the full range of social, health, environmental and economic concerns of citizens. • ” —The Honourable Roy J. Romanow Chair, Institute of Wellbeing Advisory Board • “What we measure affects what we do,and if our measurements are flawed, decisions may be distorted…what we measure shapes what we collectively strive to pursue – and what we pursue determines what we measure. • ” — Report by the Commission on the Measurement of Economic Performance and Social Progress Stiglitz, Sen and Fitoussi, September 2009
What is the Canadian Index of Wellbeing? A national index that will report regularly on the wellbeing of Canadians in eight areas or domains: • Healthy populations • Living standards • Community vitality • Democratic engagement • Time use • Arts, culture and recreation • Education • Environment
Indicators • are • powerful Why a Canadian Index of Wellbeing? • What we count and measure influences how we make policy decisions If we don’t measure wellbeing, in all of its dimensions, it doesn’t count…leaving Canadians to: • Gauge wellbeing using a narrow set of economic indicators • Misinterpret wellbeing or use surrogate measures • Ignore policy options that will fundamentally improve wellbeing
Institute of Wellbeing – Vision • To enable all Canadians to share in the highest wellbeing status by identifying, developing and publicizing statistical measures that offer clear, valid and regular reporting on progress toward wellbeing outcomes Canadians seek as a nation
Institute of Wellbeing - Goals • Promote a shared vision of what really constitutes sustainable wellbeing and the elements that contribute to or detract from it; • Measure national progress toward (or away from) achieving that vision; • Understandand promote awareness of why society is moving in the direction it is moving; • Stimulate discussion about the types of policies, programs and activities that would move us closer and faster toward achieving wellbeing; • Give Canadians tools to promote wellbeing with policy shapers and decision makers so as to account for why things are getting better or worse; and • Add momentum to the global movement for a more holistic way of measuring societal progress.
Criteria for Indicator Selection • Relevant to Canadians • Easy to understand • Reliable, scientifically robust and valid • Politically unbiased • Timely, easy to obtain and periodically update • Comparable across jurisdictions and groups • Objective or subjective • Positive or negative • A constituent or determinant of wellbeing, or both • Attributable to individuals or groups • Obtained through an open, transparent and democratic consultative review process • Going to contribute to a coherent, comprehensive view of the wellbeing of Canadians • ENV DOMAIN: Built upon a stock-flow model • ENV DOMAIN: Ties into existing national/global reporting (CESI, MDG, CBD, etc.)
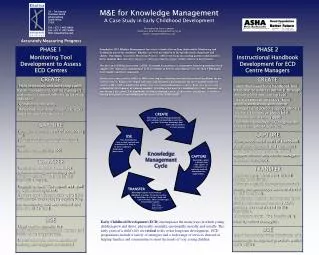
Research & Validation Process Expert literature reviews and/or environmental scans Domain reports listing indicators including eight-ten headliners for the composite Project management and Canadian Research Advisory Group (CRAG) reviews Roundtable reviews External peer reviews
CRAG – Environment Domain • Mark Anielski, Economist, Author, and President of Anielski Management Inc., Edmonton • Noel Keough, Assistant Professor of Sustainable Design, Faculty of Environmental Design, University of Calgary • Hans Messinger, Senior Advisor and former Director of Industry Measures & Analysis, Statistics Canada • Alex Michalos, CIW Director of Research; Director, Institute for Social Research and Evaluation, Professor Emeritus, Political Science, and Chancellor, University of Northern British Columbia • László Pintér, Director, Measurement and Assessment Program, International Institute for Sustainable Development, Winnipeg • Robert Smith, Director of Environment Accounts and Statistics Division, Statistics Canada
Environment Domain – Process • Work is being built upon an earlier version of the Environment Domain & learning experiences from other GPI efforts (both Cdn & Int’l) • Work compared potential frameworks & indicators against: • International frameworks & indicators/data (e.g. OECD, CBD, EPI, etc.) • Available national and local data (e.g. CESI, Statistics Canada, etc.) • Various frameworks were explored: • Ecosystem services (MEA, etc.) • State-Pressure-Response (DPSIR) • Reed Noss’s biodiversity indicator framework • HIPPO, I=PCT, Industrial ecology ‘rules’, biomimicry ‘life rules’ etc.
Environment Domain – Draft Framework FROM VICTOR ET AL., 2008
Primary Flow Indicator Wellbeing Indicator Stock Indicator Ecosystem Services SVt impact from Primary Natural Resource Sector consumption as a Factor of Production (+/-) “Raw materials” Stock Variable (SVt) SVt impact / per unit of production Environmental Health Human (physical & mental) health effects (+/-) SVt impact from household consumption (+/-) “Finished goods” SVt impact / household basket of products “Changing land use” Change in SVt from Rural and Urban development (-) Socio-economic Health Economic effects (+/-) Decrease in SVt Change in SVtfrom annual Improvements via mitigation and restoration (+) “Restoring land use” Increase in SVt
Environment Domain – Draft Framework & Indicators Proposed headline indicator • Rationale: • Air quality is valued by Canadians & nationally recorded • Climate change & GHGs are relevant to Canadians • NPRI is the only nationally consistent emissions data • Government approach to GHGs has been to invest in efficiency • Other potential indicators: • Percentage of people commuting by walking / biking / public transit / carpool / single-person vehicle? • Survey of money spent on adaptation? • Number of green buildings?
Environment Domain – Draft Framework & Indicators Proposed headline indicator • Rationale: • Water quality and quantity are also valued by Canadians and nationally recorded • Nitrogen and phosphorus have significant impacts on water quality • Water consumption (especially in water-poor watersheds) is of increasing relevance and importance to Canadians • Other potential indicators: • Clean water technology expenditures (annual amount per capita) OR Defensive water quality/quantity expenditures (annual amount per capita)? • NPRI emissions? Number of urban pesticide bans? Agricultural pesticide use?
Environment Domain – Draft Framework & Indicators Proposed headline indicator • Rationale: • Reserves are part of StatCan’s national accounts • Energy production and use are key metrics of sustainability as Canadians are amongst the most energy-hungry people on Earth • Recycling, waste and the societal “metabolism” are recognizable • Other potential indicators: • Total volume of converted reserves (partially captured in metabolic rate) • GHG intensity/joule of energy consumption (GHG/J)
Environment Domain – Draft Framework & Indicators Proposed headline indicator • Rationale: • Forest habitat is nationally measured and internationally reported • NBP provides a measure of ecosystem change, along with land cover change • Species are iconic as measures of biodiversity; especially endangered spp. • Genetic data are not readily available • Other potential indicators: • Expenditures on protected area management (dollars/capita); Access to parks • Kms of road / number of dams built / number of oil wells (driver of fragmentation) • Regulatory enforcement? Invasive species?
Putting it all together… • Indicators will be reported independently and as an index • 10 indicators will be selected as “headline indicators” • Visual presentation will be used where possible • Wellbeing “linkage” indicators are still being determined • Planned release date: November 2010
Thoughts/Questions? • Aspects of framework that could/should be modified? • Indicators that should be included/removed? • Data sets that are available? • Other thoughts/input?
Questions welcome For more information: Check the CIW website at www.ciw.ca or contact Alexis Morgan alexism@pembina.org