Download
1 / 20
200 likes | 316 Views
Long-term X-Ray Variability of NGC 4945 Amara Miller, UC Davis (SULI Program 2007) Mentor: Grzegorz Madejski, Kavli Institute, SLAC. 1. The Basics 2. Objectives: What are we looking for? 3. Data Reduction: The BRIEF Overview 4. Results 5. Discussion and Conclusions

E N D
Long-term X-Ray Variability of NGC 4945 Amara Miller, UC Davis (SULI Program 2007) Mentor: Grzegorz Madejski, Kavli Institute, SLAC
1. The Basics 2. Objectives: What are we looking for? 3. Data Reduction: The BRIEF Overview 4. Results 5. Discussion and Conclusions 6. Acknowledgements 8. References 7. Questions?
The Basics: X-ray Astronomy Celestial X-rays can be observed using rockets, balloons, or satellites. Various types of objects emit X-rays, including galaxy clusters, supernova remnants, stars, and accreting black holes. So what—why do we care? X-rays can help us understand our universe, i.e. structures of stars, galaxies, and models such as the big bang.
Black Holes and You: • An active galactic nucleus (AGN) is the massive, compact center of a galaxy which shows unusually high activity (emissions). • It is predicted that an active galaxy is powered by accretion of galactic gases onto a supermassive black hole. • Instabilities within material surrounding the nucleus begin to redistribute angular momentum and cause the matter to form an accretion disk. The material within the disk then emits varying EM radiation on multiple time scales. • The exact processes involved are still not fully understood, and the black hole model is not yet completely confirmed.
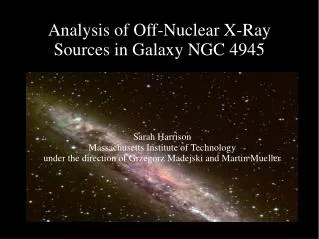
The Observation:Rossi X-ray Timing Explorer RXTE features unprecedented time resolution combined with (1) moderate spectral resolution and (2) broad-band X-ray sensitivity. The two instruments used in this project: Proportional Counter Array (PCA) High Energy X-ray Timing Experiment (HEXTE) NGC 4945 is one of four AGN for which the black hole mass can be constrained at ~1.4 × 10⁶ M⊙. It is known to vary on short time scales, but no long term studies have been performed until now. RXTE sampled data from NGC 4945 every 4 days for ~40 minutes over the course of 2006.
THE OBJECTIVE Background: Example of variability in an AGN: A light curve is a graph of the light intensity of an observed object as a function of time. In this project, the term spectrum refers to a power spectral density (PSD) graph of the variability amplitude (power) of the light curve plotted against the frequency of variability. Figure obtained from: Astrophysics Research at the IUE Observatory, 1999. This variability is often apparent in light curves, as shown above, but the frequencies that contribute to the variability are more clearly shown in a PSD.
THE OBJECTIVE Background: Example of multiple breaks in PSDs: Breaks in PSD According to [1,2], there is a strong correlation between the black hole mass of an AGN and its associated PSD break amplitude. Figure obtained from: X-ray Fluctuation Power Spectral Densities of Seyfert 1 Galaxies, A. Markowitz et. all, 2003.
THE OBJECTIVE Goals of the Project: • Further our understanding of the relationship between breaks in the power spectral density of an AGN and its black hole mass. • Supplement data that has been obtained and studied in previous experiments. • Contribute to the study of the structure of AGNs, as well as our understanding of how and why X-ray radiation is produced.
Data Reduction:A Brief Overview The energy range studied was 8-30 keV. The PCA contains five proportional counters, called PCUs. Data was obtained solely from PCU 2. HEXTE consists of two clusters of scintillation detectors. Only Cluster 1 data was used. Data was reduced using the script Rex, part of the Ftools package. Barycenter Correction was implemented using the tool faxbary. The data was binned and the count rates averaged to obtain a format suitable for a Fast Fourier Transform algorithm (FFT). A FFT was performed and a spectrum for NGC 4945 was produced.
Results: PCA light curve: These two light curves were obtained using Rex. Both have a newbin time of 86400 seconds. The average count rates for PCA and HEXTE are 1.19 and 1.02 counts/s. HEXTE light curve: There is a data gap after the first three data points. The data is then continuous, and there are regular, periodic, linear increases in the count rate.
Results: PCA/HEXTE count rate comparison: The mean line nearly has a slope of 1 (45 degrees) indicating that the two sets of data correlate, paralleling each other in shape. Errors on this graph are not include, but are ~.1-.2, or 10%. With error included, it is possible that the PCA and HEXTE data correlate better. This implies that the data reduction process was successful, and there were no unexpected discontinuities or jumps.
Results: We analyzed the energy spectrum to see if the data is consistent with previous observations of NGC 4945. The model used was a powerlaw plus a Gaussian plus a photoelectric absorption which was multiplied by a powerlaw. PCA and HEXTE modeled data: PCA and HEXTE modeled data: Most of the residuals are within the 3 to 7 keV range where there are fluctuations in the data. This graph is in a logarithmic space. The HEXTE and PCA data is continuous, with no obvious breaks.
Results: This is a preliminary graph of a PSD produced from the data obtained using the FFT. The following graphs are in logarithmic space. Left: Actual Data. There is a linear increase at higher frequencies, though there are fluctuations in the data for the first half of the graph. Right: A PSD for the same sequence of data entries—i.e. a controlled blank that can show where the instabilities in the data are. Window Function for PSD for NGC 4945: PSD for NGC 4945:
Discussion and Conclusions Long-term Variability According the the graph of the PCA count rate, the average count rate does not change much over the course of the observation, implying that there is little variability on long time scales. There does appear to be variability on smaller time scales of approximately several weeks to a month , as indicated by the linear rises. This result is reflected in the PSD. Though the first half of the data is not usable at this time, the second half of the data appears reliable. It shows an increase in variability at shorter time scales of a month to a week, just at the light curve does. This corresponds to data previously studied for NGC 4945 at shorter frequencies.
Discussion and Conclusions Light Curve Comparison The two graphs on the left show examples of intrinsic and extrinsic variability. (Note the similarity to the modeled data curve.) Because the PCA and HEXTE data correlate, there is no spectral (energy) change associated with intensity change. NGC 4945 variability is intrinsic, rather than caused by external interferences, such as clouds of gas!
Discussion and Conclusions PCA light curve: The largest radius R possible for the black hole and accreting gases can be inferred from the variability. However, because data already exists for variability on scales of days (i.e. much smaller than in this observation) this light curve tells us nothing new about the size of R for NGC 4945.
Discussion and Conclusions Future Work • Check the results and ensure the FFT was implemented correctly. • Determine a way to take into account the window function for the PSD so that the lower frequencies can but studied. • Compare results to previous studies of short term variability of NGC 4945 and investigate the PSD break frequency. • Analyze the relationship between the black hole mass and the break frequency.
Thank You! My mentor, Greg Madejski, for his patience at my constant questions as well as for his wonderful advice and support. Special thanks to Martin Mueller, for being a wonderful person as well as for helping me understand the steps needed and directing me to various programming resources. Acknowledgments
References: Philip Uttley & Ian McHardy, A Brief Review of Long-term X-ray and Optical Variability in Radio-quiet AGN. ArXiv: 2004. A. Markowitz et. all, X-Ray Fluctuation Power Spectral Densities of Seyfert 1 Galaxies. Astrophysical Journal: 2003.