Download
1 / 25
250 likes | 373 Views
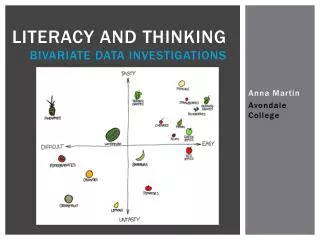
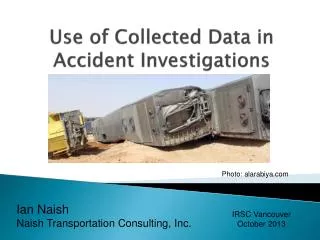
Data Investigations. L.O.: I am learning to investigate a real-life meaningful problem and choose a sensible way to represent the data. SURVEYS. What have been some surveys you have conducted during previous years at school?. SURVEYS.

E N D
Data Investigations L.O.: I am learning to investigate a real-life meaningful problem and choose a sensible way to represent the data.
SURVEYS What have been some surveys you have conducted during previous years at school?
SURVEYS What type of things do you think senior students should be conducting surveys about? • Surveys linked to real life situations/scenarios that might actually make a difference because you conducted a survey): • Investigations should be used to.. • prove something, • disprove something, or • identify if we need to improve something.
SURVEYS • Investigations should be used to.. • prove something, • disprove something, or • identify if we need to improve something. To do this we need to create an investigation question! What is a question that you would like to pose so that we could investigate it?
Today’s Whole Class Data Investigation We are going to solve a problem. • Create the investigation question. • Prepare yourself for the data collection. • Create the t-chart/column/survey table/tally chart. • Collect the data. • Understand the data. • Make the data more presentable (in graph form). • Determine if your data collection has either: • proved or disproved a statement , or • identified if something needs to be improved. • Create solution to solve the problem. • Present the solution to the proper person.
1. Discuss the investigation question: Do we need a pedestrian crossing outside school? • What is a pedestrian crossing? • Why would we need one? • How can we work out if we need one?
2. Preparing ourselves for the data collection: • What data could we collect? • From where? • At what time(s)?
3. Collecting the data: • How could we collect the data required to find the answer to our question? By watching the traffic outside of school. If there are more pedestrians (people walking) than vehicles, then we DO need a pedestrian crossing. • How could we RECORD our data? Using a table and tally marks!
What would our tally chartlook like? Do we need a pedestrian crossing outside school?
Tally chart Do we need a pedestrian crossing outside school?
4. Understanding the data: • What did we learn about in our pedestrian crossing investigation? • We collected data: Why? How? • Why did we decide to do it like that? • Is there a next step we could take?
5. Making the data more presentable: • Which graph will best display the data? Why?
6. Has the data proved / disproved / or identified something that needs to be improved? • What was our investigation question? • Has our data collection • proved something? • disproved something? • Identified that we can improve something?
Data Investigations L.O: I can create my own data investigation to prove, disprove or identify if something needs to be improved.
Your Class Data Investigation You are going to solve a problem: • Create the investigation question. • Prepare yourself for the data collection. • Create the t-chart/column/survey table/tally chart. • Collect the data. • Make the data more presentable. • Determine if your data collection has either: • proved or disproved a statement , or • identified if something needs to be improved. • Create solution to solve the problem. • Present the solution to the proper person.
Skill 1: I can create a real-life data investigation question. Is this school recycling properly? Is this school printing wisely? Does the canteen/tuckshop provide enough healthy food alternatives? Are students making wise choices with the types of food that they are eating at school? Is our school being energy efficient?
Skill 2:I can correctly create a tally chart to record my data. MUST • Discuss the data types/categories that need to be collected. • Add the categories to tally chart.
Skill 3:I can correctly record my data. • Complete the tally chart.
Skill 4: I can organise the data. • Tidying Up: • Write up tally chart neatly (if necessary) • Work out the TOTALS/FREQUENCY.
Skill 5: I can analyse the data. • Has your data collection: • proved a statement? • disproved a statement? • identified if something needs to be improved? • 2. If it has not then ask yourself… • “How can I change/modify my approach so that I can prove, disprove or identify if an improvement needs to be made?” • Do you need to increase the scope/size of the investigation?
Skill 6: I can create a graph that best displays the data. • Which graph will best display the data? • Why?
Reflection Peer assess your partner’s graph/chart. • Was it accurate? • Does they organise the data well? Why (not)? • Was it correctly labeled? • Would the graph make sense to a complete stranger?
Reflection Peer assess your partner’s data collection. • Was it accurate? • Does they organise the data well? Why (not)? • Would the data make sense to a complete stranger?
Skill 6: I can take action based on the data collected. • Create solution to solve the problem.
Skill 7: I can present the data to someone so that the proper action can be taken. • Present the solution to the proper person.