Download
1 / 34
340 likes | 530 Views
Solar Energy Market Trends and Opportunities for Local Action. Prepared for the National League of Cities Energy Committee June 9, 2010. Hannah Muller Solar America Cities Program Lead U.S. Department of Energy. Agenda. Market Developments. Solar 101. U.S. Policy Update.

E N D
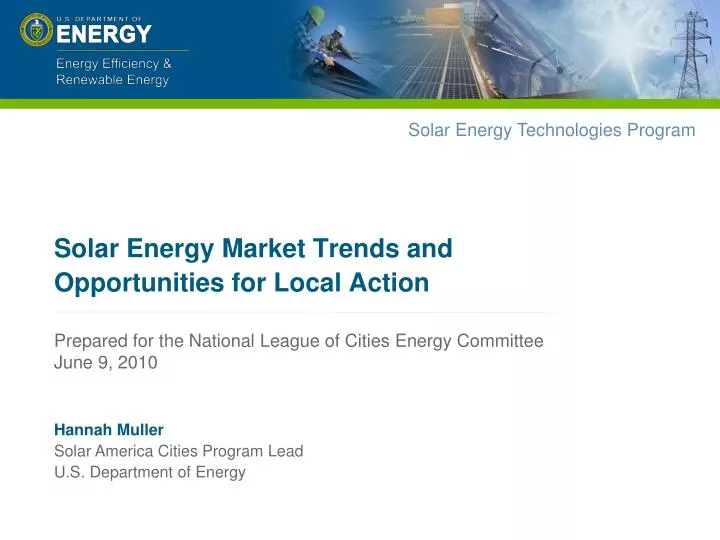
Solar Energy Market Trends and Opportunities for Local Action Prepared for the National League of Cities Energy Committee June 9, 2010 Hannah Muller Solar America Cities Program Lead U.S. Department of Energy
Agenda Market Developments Solar 101 U.S. Policy Update Opportunities for Local Action Other Cool Things U.S. & Global Installations, International Market Outlook & Events 1603 Grants, 48C Awards, Loan Guarantee Program, Legislative Update Solar America Cities Best Practices Solar Instructor Training Network, Open PV Mapping 2
Solar 101 3 Categories of Solar Technologies: Photovoltaics (PV) Concentrating Solar Power (CSP) Solar Water Heating and Air Heating and Cooling (SWHaAHC)
Solar MYTHBUSTERS Your city doesn’t get enough sun FACT: Yes it does The technology is still being developed FACT: Yes, but it’s good enough to use right now It’s just way too expensive FACT: Declining PV prices, innovative financing structures, and state/federal incentives are making it more affordable, even competitive in some areas
International Market:2008-‘12 PV Installations • Significant growth in most major markets but Germany is expected to remain the leader • The lower bound of the 2009 World and Germany data reflects projections from before the Bundesnetzagentur published its official report on 4/9/10 that 3.8GW had been installed in Germany during 2009. • The average of the Bloomberg NEF Conservative and Optimistic scenarios was used. • Simmons & Co.’s market projections did not include the year 2012. Canada, Czech Republic, India, South Korea, et. al. Sources: Barclays (4/20/10), Bloomberg NEF (4/19/10), J.P. Morgan (3/9/10), Simmons & Co. (4/20/10), Thomas Weisel Partners (4/8/10), UBS (4/15/10) 5
Market Developments:U.S. & Global Annual PV Installations • 22% rise in global and 38% increase in U.S. installations for 2008-2009 with significant growth expected for both in 2009-2010 • The lower bound of the 2010 Global projections reflects expectations from before the Bundesnetzagentur published its official report on 4/9/10 that 3.8GW had been installed in Germany during 2009. • The average of Bloomberg NEF’s Conservative and Optimistic scenarios was utilized for 2009 and 2010 • Sources: • 2002-2008: NREL, “2008 Solar Technologies Market Report” (1/20/10), • 2009: US Installations, SEIA 2009 Year In Review (4/15/10), Global, Bloomberg NEF (5/13/10), • 2010E: Barclays (4/20/10), Bloomberg NEF (4/19/10), J.P. Morgan (3/9/10), Simmons & Co. (4/20/10), Thomas Weisel Partners (4/8/10), UBS (4/15/10) 6
Market Developments:U.S. Utility Scale Solar Installations Sources: Bloomberg NEF, EIA, FERC Filings, Project Developers, News/ Press Releases, SEC Filings, SEIA, SEPA *Based upon information from the developers of Sunset Reservoir and Searchlight Solar I, both facilities will utilize SunTech modules. The precise type of crystalline silicon technology type could not be confirmed. 7
U.S. Annual PV Installations: Top 5 States • Within the U.S., solar adoption has been driven by high $/Watt incentives and high retail electricity prices, as well as the solar resource. Annual and cumulative grid-connected PV in top state markets, 2004–2008 (Sherwood 2009) 8
Reaching Grid Parity Targets will require advances in all PV system components Preliminary Data – Do Not Reference
Current Status of PV in the U.S.:Typical Residential Installation Details • 4kW system size • 12-19% efficient modules 12-25 Panels • Avg. c-Si module cost = $1.9/W Retail Markup = 20% • Avg. c-Si module price = $2.3/W • System price of $6.6/W $26,400 • 20-30 year lifetime warranties (inverters 5-15 years) Initial Installed Price Federal Tax Credit State Rebate ($1.5/W) Final System Price $26,400 $7,900 $6,000 $12,500 10
Current Status of PV in the U.S.: PV Breakeven Cost ($/W) in 2008 • Percentages represent portions of the load in which breakeven conditions may exist under our assumptions. • 19% of residential electricity sales $8/W or more. • 45% of sales $6/W or more. • Assumptions: • Home-equity type loan (tax deductible interest) • 28% marginal federal tax rate • 20% down payment • Real interest rate and discount rate of 5% • 30 year loan term and evaluation period • 30% federal investment tax credit (ITC) • Apply existing state, local, and utility incentives • Inverter replacement at 10 and 20 years • South facing, 25tilt PV system with a 77% derate factor and 0.5% annual degradation in output • 0.5% annual electricity price escalation (real) 11
PV Breakeven Cost ($/W) in 2015 • Percentages represent portions of the load in which breakeven conditions may exist under our assumptions. • 47% of residential electricity sales $5/W or more. • 75% of sales $4/W or more. • 91% of sales $3/W or more. • Assumptions: • Home-equity type loan (tax deductible interest) • 28% marginal federal tax rate • 20% down payment • Real interest rate and discount rate of 5% • 30 year loan term and evaluation period • 30% federal investment tax credit (ITC) • Apply existing state, local, and utility incentives • Inverter replacement at 10 and 20 years • South facing, 25tilt PV system with a 77% derate factor and 0.5% annual degradation in output • 0.5% annual electricity price escalation (real) 12
Policy Update:1603 Grants in Lieu of the ITC Average Award ($Mill) Solar Awards ($Mill) • Other Includes: Biomass (closed & open-loop), CHP, Fuel Cell, Hydropower, Landfill, Solar Thermal (heating) Sources: NREL (3/1/10), US Treasury (3/1/10 & 4/1/10) 13
Policy Update: “American Renewable Energy Jobs Act” • Introduced by Sen. Schumer (4 cosponsors) as S. 3069 on 3/3/10 • Referred to the Senate Banking, Housing, and Urban Affairs Committee • The bill would make the American Recovery and Reinvestment Act’s “Buy America” provisions applicable to projects applying to the Sec. 1603 Grant Program • In a letter to Secretaries Geithner and Chu on 3/2/10 four of the five sponsors stated: • “We believe Treasury has the discretion to consider domestic job preservation and creation when distributing section 1603 grants for wind and other clean-energy projects…If Treasury chooses not to exercise its discretion, we respectfully request that you defer distribution of section 1603 grants until after our legislation becomes law.” • Secretary Chu’s Response: • “’There are unintended consequences by just coming out and saying, Buy American,’ Dr. Chu said. ‘I do not want a moratorium. We have 9-10% unemployment. You do not want to stop these projects if 2/3 [of the hardware] is American and 1/3 is foreign…congressional demands that the Energy Department not fund projects that use foreign-made technology could force a halt to projects that promise to create U.S. jobs.’” Note, Emphasis in the quotes was added Sources: NYT (3/3/10), Washington Post (3/4/10), WSJ (3/5/10) 14
Policy Update: Advanced Energy Manufacturing Tax Credit, Sec. 48C • ARRA established a 30% manufacturing tax credit for renewable energy and GHG-reduction technologies, capped at a total of $2.3 Billion of tax credits • In January 2010, 183 projects were selected for the $2.3 Billion of credits • The solar projects are in at least 20 US states (excluding Solar Heating and Cooling Technologies). 15
Policy Update: Advanced Energy Manufacturing Tax Credit, Sec. 48C • Given the strong interest in the 48C Manufacturing Tax Credits, President Obama proposed an additional $5.0 Billion be appropriated in the FY’11 budget request • Bills were introduced in November, 2009 in the Senate and the House that would make solar manufacturing equipment eligible for the Section 48 investment tax credit (ITC) • A 30% credit, uncapped and available through 2016 • The credit could be taken as a cash grant from the Treasury as long as the 1603 grant program is in place • This legislation is the Solar Manufacturing Jobs Creation Act in the Senate (S. 2755), sponsored by Senators Menendez (D-NJ), Stabenow (D-MI) and Bennet (D-CO), and H.R. 4085 in the House, sponsored by Rep. Mike Thompson (D-CA) • Security in Energy and Manufacturing (SEAM) Act (H.R. 5041 & S. 3224) would appropriate an additional $5 Billion for a new round of 48C credits • HR. 5041: introduced on 4/15/1010 by Rep. Hare (D-IL) with 76 cosponsors • S. 3324: introduced on 5/6/10 by Sen. Brown (D-OH) with 5 cosponsors • Both would allow the applicant to receive the award as a grant in-lieu of a tax credit • Each bill would reprioritize several of the program’s selection criteria • H.R. 5041 would prioritize projects that manufacture qualifying advanced energy products rather than simply assembling them from components • S. 3324 would emphasize consideration of both a project’s direct job creation as well as its indirect job creation effect elsewhere in the manufacturing supply chain but within the U.S. • Both would allocate an additional $1.5 Billion to applicants that applied under the original program but were not selected in January, 2010 Source: Bloomberg NEF (5/13/10), Treasury 2010 Green Book, page 6 16
What Role Can Local Governments Play in Accelerating the Solar Market? Key Barriers under Local Government jurisdiction: Permitting Streamline solar permitting, train code officials Solar Access Strengthen solar access and solar rights ordinances Infrastructure Planning and Procurement Integrate solar energy technologies into facilities and master planning Interconnection and Net Metering Work with utility to streamline interconnection and implement favorable net metering rules Financing Create financial incentives or financing programs such as PACE and community solar that decrease upfront cost and/or spread costs over time Customer Assistance and Assurance Provide outreach and independent verification to help consumers feel more comfortable with technology Workforce Development and Training Support installer and site assessor training programs, and encourage installer certification
Solar America Cities Solar America Cities is a U.S. Department of Energy Program to increase the use and integration of solarenergy in communities across the U.S. Slide 19
25 Solar America Cities Partnerships Slide 20
SOLAR AMERICA CITIES PARTNERSHIPS:Sample Successes/Case Studies Boulder County, CO Making solar affordable: “ClimateSmart Loan Program” property assessed clean energy financing Madison, WIEducating consumers and facilitating solar purchases through the Prospective Solar Owners Agent New York, NY Overcoming utility opposition to interconnecting PV on the NYC network grid Portland, OR Streamlining the solar permitting and inspection process Tucson, AZInnovative financing for solar installations via Clean Renewable Energy Bonds (CREBs) Slide 21
Solar America Cities Special Projects • $10M in Recovery Act funding to support local government innovation and bring successful pilot policies and programs to scale for replication across the nation • Projects will launch in Spring 2010 Slide 22
SOLAR AMERICA CITY SPECIAL PROJECT EXAMPLE:Seattle Community Solar Financing Slide 23 • Goal: Develop a world-class community solar program that can be replicated by other cities • Benefits: Enables a greater portion of the community to invest in local solar energy generation • Makes solar energy accessible to renters, property owners whose roofs are not suitable for solar due to tree shading, orientation, etc. • Project components • Develop a financial and ownership model that addresses all legal, technical and logistical requirements to community solar • Install the first community solar project in Seattle • Market the program and enroll participants • Establish a solar revolving fund that will re-invest revenue generated by the first community solar project into future community solar projects and other city-owned solar energy systems
Resources on the Solar America Cities Website • Recent publications and tools: • Report: Interconnecting PV to Network Grids • Report: Review of Web-based Solar Mapping Tools • Report: The Impact of Utility Rate Structures on PV System Value – a San Diego Case Study • Upcoming publications and tools: • Economic Benefits of PACE Programs • Community Solar How-to Manual • Report: Solar-Ready Buildings: Model Ordinances and Recommendations for Consideration in Green Rating Systems • Report: Assessing Solar Economic Development Opportunities in your City • Report: Streamlining Solar Permitting through Standardized Structural Design • PV / SHW Rooftop Optimization Tool www.solaramericacities.energy.gov • Read about the program • Get the latest news and events • Search the publications database • See what cities are working on Slide 24 Slide 24 Slide 24
Announced in April 2010: New Solar America Cities Outreach Effort Goal: Provide information on solar best practices to thousands of local governments across the nation Leverages investment in 25 Solar America Cities and distributes lessons learned to other communities ICMA and ICLEI-led teams will receive $10M over 5 years to conduct outreach. Teams are developing a combined outreach plan and expect to launch activities in late summer 2010. Activities will likely include nationwide dissemination of information through newsletters and media coverage, regional conferences, and in person presentations for targeted local governments Slide 25
Solar Guide for Local GovernmentsPublished in July 2009 Organizing and strategizing efforts Accelerating demand through policies and incentives Updating and enforcing local rules and regulations Engaging utilities Creating jobs and supporting economic development Accelerating demand through outreach and education Leading by example with installations on government properties www.solaramericacities.energy.gov/resources Solar Powering Your Community: A Guide for Local Governments Provides policy and program descriptions, implementation tips and options, and real life examples in areas of: Slide 26
Solar Instructor Training Network$27M over 5 years • Supporting the training for up to 1400 instructors, resulting in a projected capacity to train up to 170,000 students Kennebec Valley Community College Midwest Renewable Energy Association Hudson Valley Community College California Community Colleges Board of Governors, California Energy Commission, California Centers for Sustainable Energy, the Labor Management Cooperation Committee Salt Lake Community College; Solar Energy International; Utah Solar Energy Association Pennsylvania State University North Carolina Solar Center at NCSU • Activities: • Sponsor instructors at “train the trainer” workshops and equip labs • Create and modify curricula and align them to highest standards • Create replicable training models for local instructors • Use innovative approaches such as online tools and mobile labs • Leverage resources and share best practices REGIONS: Northeast Northern Mid-Atlantic Southern Mid-Atlantic Southeast Midwest South-Central Rocky Mountain California/Hawaii Providers Partnership The Energy Institute at HCC - Northeast Florida Solar Energy Center at UCF Slide 27
The Open PV Project – PV Market Mapper Spatial Navigation Click and zoom from National to Street Level views of data State and County Rankings Rankings allow for easy comparison with other regions Charts & Graphs Help to visually understand the current PV market, and allow users to explore deeper Market Trends Data in the Open PV database can be used to view how the PV market changes Slide 28
Thank You Hannah Muller Solar ProgramU.S. Department of Energy Hannah.Muller@ee.doe.gov www.solar.energy.gov
Policy Update: Loan Guarantee Program (LGP) • 8/09: $2 Billion originally appropriated for the Loan Guarantee Program was redirected to fund “Cash for Clunkers” by H.R. 3435 • 12/16/09: House passed “Jobs for Main Street Act” (H.R. 2847) on 12/17/09 which would restore the $2 Billion. • 2/4/10: Doug Schultz, of the Loan Guarantee Program, stated: • Department of Energy plans to sign conditional loan guarantees with 10 to 15 additional renewable energy and energy efficiency projects in the next six months • He also said that chances are "slim" that $2 Billion that was taken away from the loan guarantee program to pay for the “Cash for Clunkers” program will be restored, despite its passage in the House • However, the DOE expects to receive $500 Million more through the recent FY’11 budget announced by President Obama to help cover credit subsidies for innovative projects • 2/23/10: BrightSource secures $1.4 Billion Loan Guarantee • 2/23/10: Conditional Loan Guarantee under section 1705 • Plans for 3 CSP plants with a cumulative 392 MW • 1st plant is expected to begin construction in H2’10 with commissioning in 2012, 2nd and 3rd plants are planned for commissioning in mid-2012 to late-2013 • 3/5/10: Overall the DOE has offered 8 conditional loan guarantees to energy related projects that are intended to significantly reduce GHG emissions (excludes automotive loans) • These 8 loan guarantees are expected to save or create at least 7,985 jobs, support the creation of 3.13GW of new electrical generating capacity (power plants & manufactured products), and reduce CO2 emissions by 30.6 Million Tons/year Sources: Baird (1/7/10 & 3/16/10), Bloomberg NEF (2/23/10), DOE Press Release (2/23/10 & 3/5/10), WSJ (2/4/10) 31
Policy Update: American Power Act (Kerry-Lieberman Climate Bill) • 5/12/10: American Power Act released to public by Senators Kerry & Lieberman • Would utilize a regulated emission credit exchange (i.e. cap-and-trade) with annual limits for most large emitters (phase-in date and allowance allocation vary by industry) • Outline sent to E.P.A. and E.I.A. on 4/28/10, each agency requires 6-8 weeks to analyze the proposal • CBO will not begin official analysis until the bill is formally introduced • 5/13/10: EPA Issues final Stationary Source GHG (“tailoring”) rule • Under current law, EPA is required to regulate if GHGs fit the CAA definition of “pollutant” and action would mitigate harms (see Supreme Court precedent of Massachusetts Vs. EPA, 2007) • Sen. Kerry: “The Obama administration has again reminded Washington that if Congress wont legislate, the EPA will regulate…Those who have spent years stalling need to understand: killing a Senate bill is no longer success.” • Sen. Murkowski’s S.J.RES. 26 (i.e. Congressional Overruling of the EPA’s Greenhouse Gas Endangerment Finding) which was introduced on 1/21/10 is continuing to circulate • 40 Senators are cosponsoring this resolution • Sen. Rockefeller introduced S. 3072 (4 cosponsors) on 3/4/10 which would suspend EPA’s GHG regulatory power for 2 years (except for motor vehicles) to give Congress more time to craft its own plan • EPA considers Sen. Rockefeller’s Bill to be incrementally preferable to Sen. Murkowski’s Resolution since it does not question the underlying conclusions/scientific research regarding climate change Sources: Baird (1/28/10, 3/1/10, & 3/3/10), Bloomberg NEF (5/14/10), Clearview (5/12/10), E&E (4/29/10 & 5/13/10), NYT (5/13/10) 32
Policy Update: American Power Act (Kerry-Lieberman Climate Bill) • American Power Act provisions relating to solar energy • Allocates $5 Billion for another round of 48C Adv. Energy Manufacturing Tax Credits • Would allow 5 years to bring an approved project online instead of the current 3 years • Explicitly includes projects intended for nuclear plants which received NRC design approval after 1993 • 2012-2049: Support to the States to finance energy efficiency & renewable energy projects (including solar) • 2012-2049: Provides funding for Energy Technologies Research & Development • Research must be expected to result in: • Reduction of energy imports • Reduction of pollution • Increase of the U.S. economy’s energy efficiency • The funding could be used to support R&D in most energy efficiency and renewable energy technologies (including Solar) as well as nuclear energy Source: Clearview (5/12/10) 33
Policy Update: American Power Act (Kerry-Lieberman Climate Bill) • Energy provisions not yet included in the American Power Act • National Renewable Electricity Standard (RES) • Clean Energy Deployment Administration (CEDA/“Green Bank”) • Expansion/enhancement of the DOE Loan Guarantee Program • Exception is $36 Billion in additional authorization for Nuclear Energy • Extension of 1603 Program • At a minimum, projects which have not begun construction by 12/31/10 are ineligible for a grant in-lieu of the ITC • New Transmission Corridors • Economic and political issues involving transmission corridor siting are seen as contentious for both parties • Although sufficient transmission capacity is a key issue in renewable energy deployment, this issue is notably absent from the bill Sources: Clearview (5/12/10), J.P. Morgan (5/10/10) 34