Download
1 / 40
400 likes | 561 Views
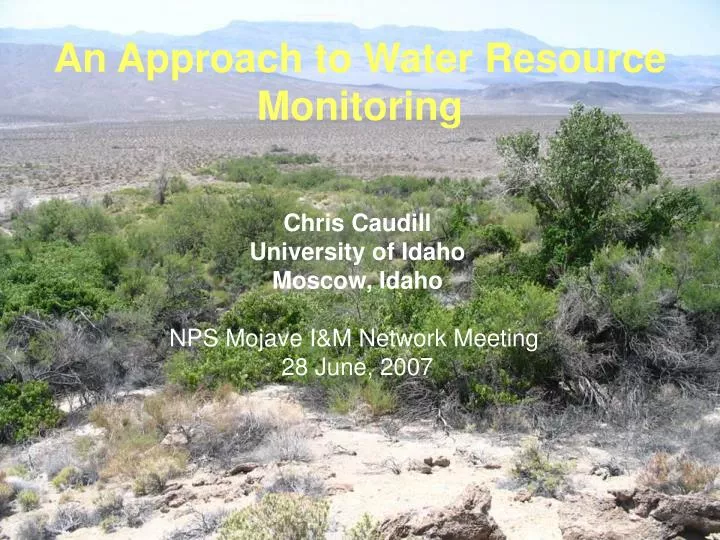
An Approach to Water Resource Monitoring. Chris Caudill University of Idaho Moscow, Idaho NPS Mojave I&M Network Meeting 28 June, 2007. Water Resources. Large water resource Pacific Northwest: ~200,000 cfs (Columbia R.). Water Resources. Large water resource

E N D
An Approach to Water Resource Monitoring Chris Caudill University of Idaho Moscow, Idaho NPS Mojave I&M Network Meeting 28 June, 2007
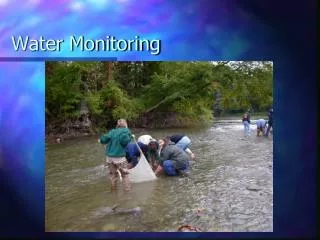
Water Resources • Large water resource • Pacific Northwest: ~200,000 cfs (Columbia R.)
Water Resources • Large water resource • Pacific Northwest: ~200,000 cfs (Columbia R.) • MOJN: ~1-100 cfs
Water Resources • Large water resource • Pacific Northwest: ~200,000 cfs (Columbia R.) • MOJN: ~1-100 cfs • Significant water resource • PNW: Does it support salmon?
Water Resources • Large water resource • Pacific Northwest: ~200,000 cfs (Columbia R.) • MOJN: ~1-100 cfs • Significant water resource • PNW: Does it support salmon? • MOJN: Can you get your hand wet?
Outline • Introduction, Background, Requirements • Identifying Monitoring Questions/Measurable Objectives • Field & Lab Methods • Sampling Design Considerations • Draft Framework • Prioritization and Allocation of Sampling Resources (Revise in Workshop!)
Water Resources • Aquatic habitats are a small area of most parks (<<1%), but are biodiversity hotspots • Support many upland species • ~25% MANZ birds riparian specialists
Water Resources • Identified as critical Vital Sign during MOJN I&M scoping workshops • Importance recognized by separate WRD funding source • Many MOJN water bodies are in degraded condition and/or under threat
Vital Signs WRD Requirements • Mandatory Regulatory Goals • Monitor degraded waters (e.g., 303(d)-listed streams). • Las Vegas Wash • Maintain Outstanding Waters (ONRW). • 4 Streams in GRBA • Provide “Measurable or quantifiable results”
Vital Signs WRD Requirements • Characterize threats, stressors, future impairments and baseline conditions • Integrate with other Vital Signs • Water quantity data must be linked to water quality issues • Draft protocol due 15 December 2007
Past MOJN WR I&M Activities • April 2005 Water Resources Workshop and subsequent meetings have: • Developed conceptual models • Identified impaired and pristine waters • Compiled historic and on-going monitoring • Identified data gaps/information needs • Developed draft PDSs for ground water and surface water Vital Signs
Identified GW Monitoring Questions • Water Quantity: • What are the long-term trends in GW level and discharge at critical springs? • What is the variability in GW level and discharge at critical springs? • What is the relationship between GW discharge and biotic communities? • How are climate change and GW pumping affecting spring discharge and biota? • Water Quality: • How does GW quality change with time?
Identified Surface Water Questions • Regulatory: • Are the waters of Las Vegas Wash within LAME meeting CWA WQ criteria? • Is flow and water quality in the GRBA ONRW streams changing over time? • What is the status, trend, and variability in discharge, chemistry, and biota of MOJN springs? • How are GRBA lake levels, ice-out dates, and water chemistry changing over time?
MOJN Water Resources Develop a habitat & park-specific monitoring approach
MOJN Water Resources Develop a habitat & park-specific monitoring approach
MOJN Water Resources Develop a habitat & park-specific monitoring approach
MOJN Water Resources Develop a habitat & park-specific monitoring approach
MOJN Water Resources GW Surface Water Springs Streams Reservoirs Lakes
MOJN Water Resources GW Surface Water Springs Discharge Chemistry Biota Streams CWA Discharge Chemistry Biota Reservoirs Lakes Level Ice-out Chemistry What to Measure?
MOJN Water Resources GW Surface Water Springs Discharge Chemistry Biota Streams CWA Discharge Chemistry Biota Reservoirs Lakes Level Ice-out Chemistry What to Measure? GRBA, MOJN, (LAME) All Parks (LAME) GRBA Where?
MOJN Water Resources GW Surface Water Springs Discharge Chemistry Biota Streams CWA Discharge Chemistry Biota Reservoirs Lakes Level Ice-out Chemistry What to Measure? GRBA, (LAME) All Parks (LAME) GRBA Where?
MOJN Water Resources GW Surface Water Springs Discharge Chemistry Biota Streams CWA Discharge Chemistry Biota Reservoirs Lakes Level Ice-out Chemistry What to Measure? GRBA, MOJN, (LAME) All Parks (LAME) GRBA Where?
Conceptual Models / PDS Monitoring Questions Measurable Objectives Statistical Considerations Testable Hypotheses Logistical & $ Considerations SOP’s Sampling Design Monitoring Protocol Data collection
Moving from Monitoring Questions to Measurable Objectives Ground Surface Water Status and Trend Climate Change & GW Pumping Status and Trend in Biotic Communities Discharge
Moving from Monitoring Questions to Measurable Objectives Ground Surface Water Status and Trend Climate Change & GW Pumping Status and Trend in Biotic Communities Chemistry Discharge Biota
Moving from Monitoring Questions to Measurable Objectives Ground Surface Water Status and Trend Climate Change & GW Pumping Status and Trend in Biotic Communities Chemistry Discharge Biota • Measurable Objectives (Testable Hypotheses) • What is the mean, variability, and trend in: • Spring discharge • Core water quality parameters (temperature, pH, DO, conductivity) • Biotic Communities
Spring Sampling Methods • Discharge • Challenging to estimate directly at springs • Weir and gage: expensive, large springs • Cup & stopwatch point estimates: small springs • Visual estimates: seeps
Spring Sampling Methods • Discharge • Challenging to estimate directly at springs • Weir and gage: expensive: large springs • Cup & stopwatch point estimates: small springs • Visual estimates: seeps • Indirect estimates for trends through time: • Changes in spring brook length • Changes in area of spring riparian vegetation • Temperature loggers: timing and frequency of drying
Spring Sampling Methods • Water chemistry • Potential use of geochemistry to infer ground water age and source • Core water quality parameters: Temperature, DO, pH, and Conductivity • Monitor intensively at large springs using multiprobes • Obtain point estimates at small springs
Spring Sampling Methods • Biotic Communities: Resources and Bioindicators • Invertebrate communities (spring-obligates, especially springsnails) • Vertebrates • Riparian Vegetation • Habitat Characteristics (substrate, canopy cover, etc.
Spring Sampling DesignWhere to take samples in space and time • Statistical Considerations • Stratify by size: • Large springs: select critical sites within each park (judgmental sample) • Small springs: use spatially balanced sampling (e.g., GRTS) to select sites at each park (probabilistic sample) • Exclude some classes of springs? • Statistical power estimates will be difficult due to lack of baseline data
Logistical and $ Considerations • Annual water resource monitoring budget: ~$80K • Small spring sampling ~$950 / site, ~$57K for 60 sites / year • 2-3 year rotating panel design to achieve adequate sample size within parks • Large spring multiprobe sampling ~$7K setup + $2K recurring costs / site • Phase in over several years, rotate multiprobe among sites within park to increase spatial coverage
Springs Sampling Design Summary • Large Springs: Intensive sampling at targeted sites (discharge, chemistry, biota) • Small Springs: Semi-annual sampling of subset of springs to infer park-wide conditions Park A Park A Park C Year 3 (or 4), Park A & B Year 2, Park C & D Year 1, Park A & B
Great Basin NP Sampling? • Integrate I&M monitoring with on-going monitoring • Four streams with Outstanding Natural Resource Waters designation • Discharge at 2 USGS gages • Core water quality parameters • Macroinvertebrate sampling • Lakes • Estimate ice-out dates with temperature loggers, lake level with pressure loggers • Core water quality parameters
Monitoring Questions Measurable Objectives Statistical Considerations Testable Hypotheses Logistical & $ Considerations SOP’s Sampling Design Monitoring Protocol Data collection
Monitoring Questions Measurable Objectives Statistical Considerations Testable Hypotheses Logistical & $ Considerations SOP’s Sampling Design Monitoring Protocol Data collection