Download
1 / 11
110 likes | 208 Views
Constraining Fire Emissions Using Tropospheric CO Measurements Prasad Kasibhatla Duke University Collaborators Avelino Arellano, Louis Giglio, Jim Randerson, Guido van der Werf, Jim Collatz QUEST Fire Meeting October 28, 2005. Why Are We Interested in CO?. CO can provide insights into

E N D
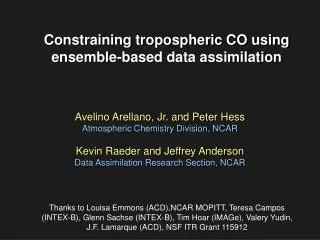
Constraining Fire Emissions Using Tropospheric CO Measurements Prasad Kasibhatla Duke University Collaborators Avelino Arellano, Louis Giglio, Jim Randerson, Guido van der Werf, Jim Collatz QUEST Fire Meeting October 28, 2005
Why Are We Interested in CO? • CO can provide insights into • ‘intensities’ of certain • anthropogenic activities
Remote Sensing Products Biomass Burning C Emissions GFED Tropospheric CO
Field Measurements/ Satellite Observations Assimilated Meteorological Fields Bottom-up Inventories (a priori) 3D Model CO Concentrations (response) Global Chemical Transport Model (forward) Top-down Inventories (a posteriori) Statistical Model (inverse) Errors Atmospheric CO Observations (in-situ, remote-sensed) Forward and Inverse Modeling
Inverse Emission Estimates black = prior red = post. Tg CO/yr
Comparison With CMDL Surface Measurements circles = obs blue = prior red = post
CO and CO2 Anomalies Inverse Analysis Using CMDL Surface Measurements Bayesian inversion: Prior scalar = 1 with 2-sigma error = 1.0
CO and CO2 Anomalies Inverse Analysis Using CMDL Surface Measurements black = obs; blue = prior; red = posterior
Summary and Future Needs • Satellite trop chem measurements have the potential for increasing our • understanding of magnitude and variability of trace gas emissions • For realizing this full potential • Need to characterize biases (e.g. model transport, model • chemistry, model a priori source patterns, measurements) • Need to develop methods for using different types of measurements • (e.g. surface, aircraft and satellite; multiple species) and of • different species simultaneously