Download
1 / 18
180 likes | 319 Views
Productivity and nutrient cycling in tropical systems [see also Payne Ch. 5]. Comparison of daily and annual photosynthetic rates and chlorophyll a levels in Laurentian and African lakes (Hecky 2000). Daily (mg C m -2 day -1 ). Annual (mg C m -2 year -1 ). Chl a (mg m -3 ). Max. Min.

E N D
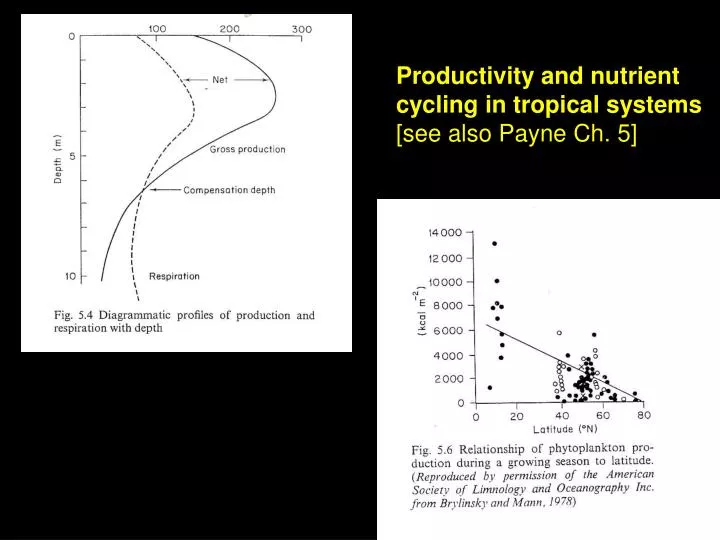
Productivity and nutrient cycling in tropical systems [see also Payne Ch. 5]
Comparison of daily and annual photosynthetic rates and chlorophyll a levels in Laurentian and African lakes (Hecky 2000) Daily (mg C m-2 day-1) Annual (mg C m-2 year-1) Chl a (mg m-3) Max Min Mean Max Min
CO2 + H2O CH2O + O2 Productivity may be measured in units of mgC volume-1 time-1 Because 2 moles of O2 are generated to fix 1 mole of C, productivity may also be measured in units of mgO2 volume-1 time-1 Ratio of moles of carbon to moles of oxygen = 12/32 = 0.375; i.o.w. 1 mg O2 produced = 0.375 mg C fixed Examples of productivity measurement techniques: Light - dark bottles Diel cycles in oxygen levels 14C uptake
What is a limiting nutrient for primary production? What is the likely limiting nutrient for primary production in the tropics?
Lake enclosures Algal bioassays
Aerial view of Lake 227 in 1994. Note the bright green color caused by algae stimulated by the experimental addition of phosphorus for the 26th consecutive year. Lake 305 in the background is unfertilized. Entire lake assays View from above Lake 226 divider curtain in August 1973. The bright green color results from blue-green algae (Cyanobacteria), which are growing on phosphorus added to the near side of the curtain.
Cyanobacteria living in the leaves of the mosquito fern (Azolla)
Cyanobacteria Bloom Anabaena Microcystis Aphanizomenon
Toxin and Taste-and-Odor Producing Cyanobacteria (list is not exhaustive) [LYN, lyngbyatoxin-a; APL, aplysiatoxins; LPS, lipopolysaccharides; CYL, cylindrospermopsins; MC, microcystins; NOD, nodularins; ANA, anatoxins; BMAA, β-N-methylamino-L-alanine; NEO, neosaxitoxins; SAX, saxitoxins; GEOS, geosmin; MIB, 2-methylisoborneol] Table courtesy of Jennifer Graham, USGS
produces energy costs energy