Download
1 / 8
80 likes | 198 Views
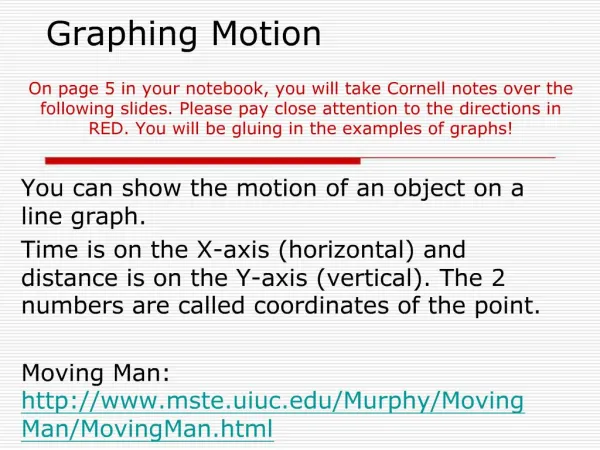
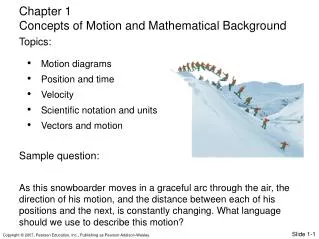
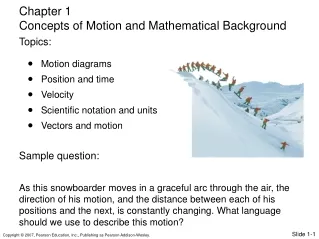
P 251 Laboratory Activity 1 Introduction to Motion Graphing Position and Velocity. The motion of an object can be represented graphically by plotting graphs of position, velocity, and acceleration versus time. In this activity we will only consider position and velocity graphs.

E N D
P 251 Laboratory Activity 1 Introduction to Motion Graphing Position and Velocity
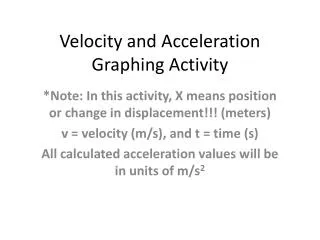
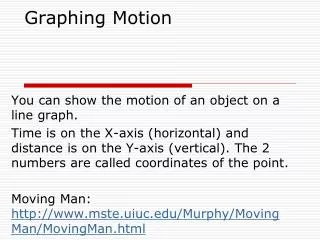
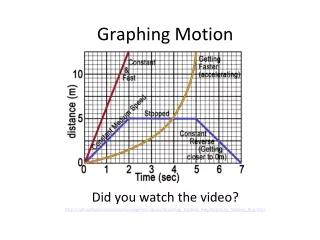
The motion of an object can be represented graphically by plotting graphs of position, velocity, and acceleration versus time. In this activity we will only consider position and velocity graphs. Object starts at the origin and moves to the right at a constant speed of 0.5m/s for 4s (2m). Object stops for 3s. Object moves to the right at 1.0m/s for 3s (3m). Object moves to the left at 2.0m/s for 2s (4m).
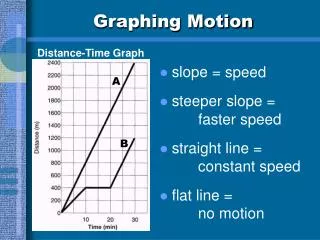
Interpreting Motion Graphs 1. Position graph is a straight line sloping upward (+) from left to right. Slope equals 0.5m/s. Velocity graph is a horizontal line @ 0.5m/s. (10,5) (4,2) (7,2) 2. Position graph is a horizontal line…NO Motion.Slope equals 0. Velocity graph is a horizontal line @ 0m/s. (12,1) (0,0) 3. Position graph is a steeper straight line sloping upward (+) from left to right. Slope equals 1.0m/s. Velocity graph is a horizontal line @ 1.0m/s. 4. Position graph is a steeper straight line sloping downward (-) from left to right. Slope equals -2.0m/s Velocity graph is a horizontal line @ -2.0m/s.
Straight Line Position Graph: 1. Slope equals velocity. Velocity is CONSTANT 2. Zero slope (horizontal line) means NO MOTION. 3. (+) slope means motion AWAY from the origin. Distance from origin is increasing. 4. (-) slope means motion TOWARD the origin. Distance from origin is decreasing.
4 Toward 1 Constant -0.75 1 Stopped 1 Constant 0 1 Away 3.75 Constant 0.46
0 Away 1 Constant 0.5 1 Stopped 1 Constant 0 1 Away 2 Constant 0.33
2 Stopped 2 Constant 0 2 Away 5 Constant 1