Download

1 / 29
290 likes | 461 Views
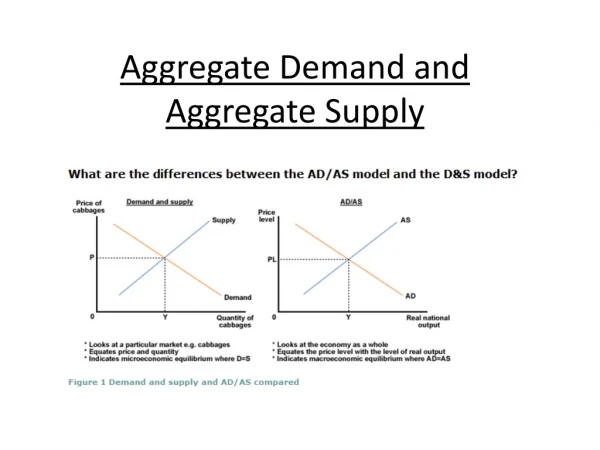
Topic 2 – Aggregate Demand, Supply, and Equilibrium. Agenda. Flow diagrams How can we tell if the econ is doing well? Short -run Economic Equilibrium Aggregate Demand Aggregate Supply Long-run Economic Equilibrium. 1. What are the main components of an economy ? Circular Flow Diagram.

E N D
Agenda • Flow diagrams • How can we tell if the econ is doing well? • Short-run Economic Equilibrium • Aggregate Demand • Aggregate Supply • Long-run Economic Equilibrium
1. What are the main components of an economy?Circular Flow Diagram
What are we missing? • Government • Shareholders (investors) • Firm’s investment • Banks • Other countries
Government taxes, transfers and spends Government Taxes and Transfers Gov’t Spending Consumers Output Market Factor Market Firms Note: We assume taxation only on people, not on firms
The rich get dividends and earn profits Government Consumers Output Market Factor Market Profits Firms
Buying machines can make firms more productive Government Consumers Output Market Factor Market Investment Firms
Banks and markets allow for borrowing and saving Government Consumers Save / Interest Financial Market Output Market Factor Market Loan/Repay Firms
Trade with other countries Government Loan/Repay Consumers Save / Interest Financial Market Output Market Factor Market Imports Loan/Repay Firms Loan/Repay Exports Rest of the World
The U.S. “economy” LR equilibrium SR equilibrium
What is SR equilibrium? Short Run Aggregate Supply Short Run Aggregate Demand Quantity 4 1 2 3
Shift of the AD1. Change in Determinants • Changes in Consumption • Wealth, Expectations, Borrowing, Taxes • Changes in Investment • Interest Rate, Expected Returns • Changes in Gov’t Spending • fiscal policy changes
Determinants (contd.) • Changes in Net Exports • Income or Wealth in Foreign countries • Exchange Rates • Tariffs, etc.
Multiplier Effect: consider G Government +$10 • Assume MPC=0.50 (different from notes) +$5 +$2.50 +$10 +$5 +$2.50 Consumers +$10 +$5 +$2.50 Output Market Factor Market +$10 +$5 +$2.50 Firms
Effect of tax change on AD Government • Assume MPC=0.50 (different from notes) +$5 +$2.50 +$5 +$2.50 Consumers Output Market Factor Market +$5 +$2.50 +$5 +$2.50 Firms Total: 5/(1-0.5) = 10
What is aggregate supply? Do firms in aggregate behave differently than they do individually?
Long-Run AS graphs • Short-Run Agg Supply Agg Supply Price Price Quantity Quantity 4 4 1 1 2 2 3 3
Defining the LR Equilibrium i.e. Identifying if the economy is doing well or poorly.
Defining a Long-Run AS-AD equilibrium • We said: “(An economy is doing well) if the total amount of goods being produced in the short run is the same as that which would ideally be produced in the long run” • LR AS-AD Equilibrium: When the short-run equilibrium is the same as the long-run equilibrium LRAS Price SRAS AD
Recall: The U.S. “economy” • We measure AD-AS equilibrium using GDP • We measure LRAS using the trend line LRAS SR equilibrium
What if we aren’t at equilibrium? (ie. Business cycles) • Ex. AD increases above NRO (note: We always assume sticky wages) • AD shift causes prices to increase. In the LR, this implies wages will increase so production costs more. Therefore, firms produce less, shifting SRAS curve left. Price SRAS (new) 2 SRAS (original) AD (new) 1 AD (original) Quantity 4 1 2 3
This is an example of Demand Pull inflation • A price increase in equilibrium due to a shift in aggregate demand. Price SRAS (new) 2 SRAS (original) AD (new) 1 AD (original) Quantity 4 1 2 3
What if we aren’t at equilibrium (contd.)? • Ex. AS decreases below NRO (say we have a jump in input prices) • Prices decrease. In the LR, either 1) SR-AS increases (and result is recession “never happened” or 2) (diagrammed) AD increases (firms lower wages because of lower prices, so can increase production). Price SRAS (new) 2 SRAS (original) 1 AD (new) AD (original) Quantity 4 1 2 3
This is an example of Cost Push inflation • A price in equilibrium due to shift in SR aggregate supply Price SRAS (new) 2 SRAS (original) 1 AD (new) AD (original) Quantity 4 1 2 3
What if we aren’t at equilibrium (contd.)? • Ex. Technology shifts LRAS(online shopping) • In the LR: 1) AD increases (price levels increase); or 2) SRAS increases (costs decrease); or 3) Both SRAD (original) Quantity 4 1 2 3 Price SRAS (original) 1 SRAD (new) 2
How are equilibrium and the unemployment related? • What does lower wages really mean? • Sure, all wages could go down, but usually it means that firms let people go. • This yields the following general results: