Download
1 / 50

E N D
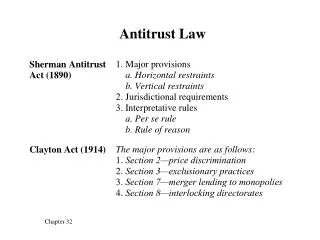
Antitrust Notice • The Casualty Actuarial Society is committed to adhering strictly to the letter and spirit of the antitrust laws. Seminars conducted under the auspices of the CAS are designed solely to provide a forum for the expression of various points of view on topics described in the programs or agendas for such meetings. • Under no circumstances shall CAS seminars be used as a means for competing companies or firms to reach any understanding – expressed or implied – that restricts competition or in any way impairs the ability of members to exercise independent business judgment regarding matters affecting competition. • It is the responsibility of all seminar participants to be aware of antitrust regulations, to prevent any written or verbal discussions that appear to violate these laws, and to adhere in every respect to the CAS antitrust compliance policy.
Expanding Analytics through the Use of Machine LearningSCCAC Meeting 6 June 2013Christopher Cooksey, FCAS, MAAA
Agenda… What is Machine Learning? How can Machine Learning apply to insurance? Model Validation Non-rating Uses for Machine Learning Rating Applications of Machine Learning Analysis of high dimensional variables
What is Machine Learning? Machine Learning is a broad field concerned with the study of computer algorithms that automatically improve with experience. A computer is said to “learn” from experience if… …its performance on some set of tasks improves as experience increases. Machine Learning, Tom M. Mitchell, McGraw-Hill, 1997.
What is Machine Learning? • “Abstract. There are two cultures in the use of statistical modeling to reach conclusions from data. One assumes that the data are generated by a given stochastic data model. The other uses algorithmic models and treats the data mechanism as unknown. The statistical community has been committed to the almost exclusive use of data models. This commitment has led to irrelevant theory, questionable conclusions, and has kept statisticians from working on a large range of interesting current problems….If our goal as a field is to use data to solve problems, then we need to move away from exclusive dependence on data models and adopt a more diverse set of tools.” • “Statistical Modeling: Two Cultures”, Leo Breiman, • Statistical ScienceVol 16, No. 3 (Aug 2001), 199-215
What is Machine Learning? • “Faced with an applied problem, think of a data model….But when a model is fit to data to draw quantitative conclusions: • The conclusions are about the model’s mechanism, not about nature’s mechanism. • It follows that: • If the model is a poor emulation of nature, the conclusions may be wrong. • These truisms have often been ignored in the enthusiasm for fitting data models….It is a strange phenomenon – once a model is made, then it becomes truth and the conclusions from it are infallible.” • “Statistical Modeling: Two Cultures”, Leo Breiman, • Statistical ScienceVol 16, No. 3 (Aug 2001), 202
What is Machine Learning? • Applications of Machine Learning include… • Recognizing speech • Driving an autonomous vehicle • Predicting recovery rates of pneumonia patients • Playing world-class backgammon • Extracting valuable knowledge from large commercial databases • Many, many, others…
What is Machine Learning? Limited to only those models which can be solved. More general approach, but must worry about local minima.
What is Machine Learning? Machine Learning Actuaries Probability and Statistics
How can Machine Learning apply to insurance? • Machine Learning includes many different approaches… • Neural networks • Decision trees • Genetic algorithms • Instance-based learning • Others • …and many different approaches for improving results • Ensembling • Boosting • Bagging • Bayesian learning • Others • Focus here on decision trees – applicable to insurance & accessible
How can Machine Learning apply to insurance? • Basic Approach of Decision Trees • Data split based on some target and criterion • Target: entropy, frequency, severity, loss ratio, loss cost, etc. • Criteria: maximize the difference, maximize the Gini coefficient, minimize the entropy, etc. • Each path is split again until some ending criterion is met • Statistical tests on the utility of further splitting • No further improvement possible • Others • The tree may include some pruning criteria • Performance on a validation set of data (i.e. reduced error pruning) • Rule post-pruning • Others Number of Units 1 >1 Cov Limit <=10k >10k Number of Insured 1,2 >2
How can Machine Learning apply to insurance? Leaf Node 1 Leaf Node 2 Leaf Node 3 Leaf Node 4 • In decision trees all the data is assigned to one leaf node only • Not all attributes are used in each path – • for example, Leaf Node 2 does not use Number of Insured
How can Machine Learning apply to insurance? Freq = 0.022 Freq = 0.037 Freq = 0.012 Freq = 0.024 Segment 1 Segment 2 Segment 3 Segment 4 • Decision trees are easily expressed as lift curves • Segments are relatively easily described
How can Machine Learning apply to insurance? • Who are my highest frequency customers? • Policies with higher coverage limits (>10k) and multiple units (>1) • Who are my lowest frequency customers? • Policies with lower coverage limts (<=10k), multiple units (>1), but lower numbers of insureds (1 or 2)
How can Machine Learning apply to insurance? • This approach can be used on different types of data • Pricing • Underwriting • Claims • Marketing • Etc. • This approach can be used to target different criteria • Frequency • Severity • Loss Ratio • Retention • Etc. • This approach can be used at different levels • Vehicle/Coverage or Peril • Vehicle • Unit/building • Policy • Etc.
Model Validation • Why validate models? • Because you have to… • …and because you should.
Model Validation • Hold-out datasets • Used two methods – • Out of sample: randomly trained on 70% of data; validated against remaining 30% of data. Training Data Validation Data 1 2 3 4 5 6 7 8 1 3 4 2 8 9 9 10 11 12 5 6 7 10 11 20 15 13 14 15 16 12 13 14 16 17 18 19 20 17 18 19
Model Validation • Hold-out datasets • Used two methods – • Out of sample: randomly trained on 70% of data; validated against remaining 30% of data. • Out of time: trained against older years of data; validated against newest years of data. Training Data Validation Data 2005 2005 2008 2006 2006 2009 2007 2007 2008 2009
Non-rating Uses for Machine Learning Underwriting Tiers and Company Placement Target frequency at the policy level Define tiers based on similar frequency characteristics. Tier 3 Tier 2 Tier 1 Note that a project like this would need to be done in conjunction with pricing. This sorting of data occurs prior to rating and would need to be accounted for.
Non-rating Uses for Machine Learning Straight-thru versus Expert UW Target frequency or loss ratio at the policy level Consider policy performance versus current level of UW scrutiny. Do not forget that current practices affect the frequency and loss ratio of your historical business. Results like this may indicate modifications to current practices.
Non-rating Uses for Machine Learning “I have the budget to re-underwrite 10% of my book. I just need to know which 10% to look at!” With any project of this sort, the level of the analysis should reflect the level at which the decision is made, and the target should reflect the basis of your decision. In this case, we are making the decision to re-underwrite a given POLICY. Do the analysis at the policy level. (Re-inspection of buildings may be done at the unit level.) To re-underwrite unprofitable policies, use loss ratio as the target. Note: when using loss ratio, be sure to current-level premium at the policy level (not in aggregate).
Non-rating Uses for Machine Learning Re-underwrite or Re-inspect Target loss ratio at the policy level Depending on the size of the program, target segments 7 & 9 as unprofitable. If the analysis data is current enough, and if in-force policies can be identified, this kind of analysis can result in a list of policies to target rather than just the attributes that correspond with unprofitable policies (segments 7 & 9).
Non-rating Uses for Machine Learning Profitability – reduce the bad Target loss ratio at the policy level Reduce the size of segment 7 – consider non-renewals and/or the amount of new business. There is a range of aggressiveness here which may also be affected by the regulatory environment.
Non-rating Uses for Machine Learning Profitability – increase the good (target marketing) Target loss ratio at the policy level If the attributes of segment 5 define profit-able business, get more of it. This kind of analysis defines the kind of business you write profitably. This needs to be combined with marketing/demographic data to identify areas rich in this kind of business. Results may drive agent placement or marketing.
Non-rating Uses for Machine Learning Quality of Business Target loss ratio at the policy level Knowing who you write at a profit and loss, you can monitor new business as it comes in. Monitor trends over time to assess the adverse selection against your company. Estimate the effectiveness of underwriting actions to change your mix of business.
Non-rating Uses for Machine Learning Quality of Business Here you can see adverse selection occurring through March 2009. Company action at that point reversed the trend. This looks at the total business of the book. Can also focus exclusively on new business.
Non-rating Uses for Machine Learning 66.1% LR Agent/broker Relationship Target loss ratio at the policy level Use this analysis to inform your understanding of agent performance. Red 41.3% LR 30.9% LR Yellow Green Actual agent loss ratios are often volatile due to smaller volume. How can you reward or limit agents based on this? A loss ratio analysis can help you understand EXPECTED performance as well as actual.
Non-rating Uses for Machine Learning Agent/broker Relationship More profitable than expected… This agent writes yellow and red business better than expected. Best practices – is there something this agent does that others should be doing? Getting lucky – is this agent living on borrowed time? Have the conversation to share this info with the agent.
Non-rating Uses for Machine Learning Agent/broker Relationship Less profitable than expected… This agent writes all business worse than expected. Worst practices – is this agent skipping inspections or not following UW rules? Getting unlucky – This agent doesn’t write much red business. Maybe they are given more time because their mix of business should give good results over time.
Non-rating Uses for Machine Learning Agent/broker Relationship Agents with the most Red Business Not only is the underlying loss ratio higher, but the odds of that big loss is much higher too. Agents with the most Green Business Some of these agents who write large amounts of low-risk business get unlucky, but the odds are good that they’ll be profitable.
Non-rating Uses for Machine Learning Retention Analyses Target retention at the policy level What are the common characteristics of those with high retention (segment 7)? This information can be used in a variety of ways… • Guide marketing & sales towardscustomers with higher retention • Form the basis of a more formal lifetime value analysis • Cross-reference retention and loss ratio to get a more useful look…
Non-rating Uses for Machine Learning Retention Analyses Simple looks at retention can be even more useful when cross-referenced with loss ratio. Is a segment of business above or below average retention? Above or below the target loss ratio? Note: retention is essentially a static look at your book. What kinds of customers retained? What kinds didn’t? There is no consideration of the choice customers had at renewal. Were they facing a rate change and renewed anyway?
Rating Applications of Machine Learning The Quick Fix Target loss ratio at the coverage level The lift curve is easily translated into relativities which can even out your rating. Note that the quickest fix to profitability is taking underwriting action. But the quickest fix for rating is to add a correction to existing rates. This can be done because loss ratio shows results given the current rating plan.
Rating Applications of Machine Learning The Quick Fix First determine relativities based on the analysis loss ratios. Then create a table which assigns relativities. Note that this can be one table as shown, or it can be two tables: one which assigns the segments and one which connects segments to relativities. The exact form will depend on your system.
Rating Applications of Machine Learning Creating a class plan from scratch Machine Learning algorithms, such as decision trees, can be used to create class plans rather than just to modify them. However, they will not look like any class plan we are used to using. “An 18 year old driver in a 2004 Honda Civic, that qualifies for defensive driver, has no violations but one accident, with a credit score of 652, who lives in territory 5 and has been with the company for 1 year, who has no other vehicles on the policy nor has a homeowners policy, who uses the vehicle for work, is unmarried and female, and has chosen BI limits of 25/50 falls in segment 195 which has a rate of $215.50.” Traditional statistical techniques, such as Generalized Linear Models, are more appropriate for this task. However, the process of creating a GLM model can be supplemented using decision trees or other Machine Learning techniques.
Rating Applications of Machine Learning Creating a class plan from scratch
Rating Applications of Machine Learning Creating a class plan from scratch Using Machine Learning and GLMs together…
Rating Applications of Machine Learning Second way to “enhance” GLMs – rebalance the workload The first place to look is in how much effort is put into building the initial GLM. These become more acceptable knowing that Rule Induction will explore the non-linear signal.
Analysis of high dimensional variables High Dimensional Variables • Geographic and vehicle information are classic examples of predictors with many, many levels. • Geographic building blocks of Territories are usually county/zip code combinations, zip code, census track, or lat/long. • Vehicle building blocks of Rate Symbols are usually VINs. • In both cases, you cannot simply plug the building blocks into a GLM; the data aretoo sparse. You need to group “like” levels in order to reduce the total number of levels. In other words, you need to find Territory Groups or Rate Symbol Groups. • Note: once grouped, you should use a GLM to determine rate relativities. This ensures that these parts of the class plan are in sync with the others.
Analysis of high dimensional variables High Dimensional Variables • Current analytical approaches for geography use some form of distance in order to smooth the data, providing estimates of risk for levels with little to no data. • Once each building block has a credible estimate of risk, levels with similar risk are clustered together into groups. • Issues with this approach: • What is the measure of risk to be smoothed? • What distance measure should be used? • What smoothing process & how much smoothing? • What clustering process & how many clusters?
Analysis of high dimensional variables High Dimensional Variables • Tree-based approaches, a form of rule induction, provide a simpler alternative. • Geographic proxies are attached to the data. • Census/demographic data • Weather data • Retail data • Etc. • Branches of the tree define territories… • Segment 1 = Territory 1 = all zip codes where rainfall > 0.1 and popdensity < 0.5 • Zip codes with little data will not drive the analysis, but will get assigned to groups. No need for smoothing.
Analysis of high dimensional variables High Dimensional Variables • Eliade Micu presented a direct comparison between these two approaches: smoothing/clustering versus rule induction. • He found quite similar results, though his version of rule induction did outperform his version of smoothing/clustering. • This presentation can be found on-line at the CAS Website: • Seminar Presentations of the 2011 RPM Seminar • Session PM-10: Territorial Ratemaking (Presentation 2) • http://www.casact.org/education/rpm/2011/handouts/PM10-Micu.pdf • Extension of smoothing/clustering to vehicle information can be problematic. What is “distance”? What are “like” VINs? However rule induction can be applied to vehicle information in an exactly analogous manner.
Expanding Analytics through the Use of Machine Learning • Summary • The more accessible Machine Learning techniques, such as decision trees, can be used today to enhance insurance operations. • Machine Learning results are not too complicated to use in insurance. • Non-rating applications of Machine Learning span underwriting, marketing, product management, and executive-level functions. • Actuaries should pursue the business goal most beneficial to the company – this may include some of these non-rating applications. • Rating applications of Machine Learning include both quick fixes and fundamental restructuring of rating algorithms. • Rule induction has intriguing applications to analyzing high dimensional variables.
Expanding Analytics through the Use of Machine Learning Questions? Contact Info Christopher Cooksey, FCAS, MAAA EagleEye Analytics ccooksey@eeanalytics.com www.eeanalytics.com