Download
1 / 49
490 likes | 496 Views
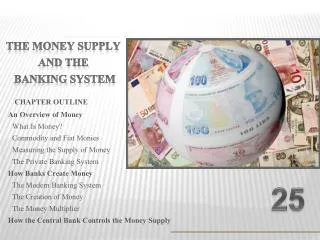
This chapter provides an overview of the labor market, unemployment, and inflation. It examines the classical view of the labor market, the relationship between unemployment and inflation, and the factors that contribute to the existence of unemployment. It also discusses sticky wages, efficiency wage theory, imperfect information, minimum wage laws, and the short-run trade-off between inflation and unemployment.

E N D
14 The Labor Market,Unemployment,and Inflation Chapter Outline The Labor Market: Basic ConceptsThe Classical View of the Labor MarketThe Classical Labor Market and the Aggregate Supply CurveThe Unemployment Rate and the Classical ViewExplaining the Existence of UnemploymentSticky WagesEfficiency Wage TheoryImperfect InformationMinimum Wage LawsAn Open QuestionThe Short-Run Relationship Between the Unemployment Rate and InflationThe Phillips Curve: A Historical PerspectiveAggregate Supply and Aggregate Demand Analysis and the Phillips CurveExpectations and the Phillips CurveIs There a Short-Run Trade-Off Between Inflation and Unemployment?The Long-Run Aggregate Supply Curve, Potential GDP, and the Natural Rate of UnemploymentThe Nonaccelerating Inflation Rate of Unemployment (NAIRU)Looking Ahead
THE LABOR MARKET: BASIC CONCEPTS The labor force (LF) is the number of employed plus unemployed: LF = E + U unemployment rate The number of people unemployed as a percentage of the labor force. Unemployment rate = U/LF
THE LABOR MARKET: BASIC CONCEPTS frictional unemployment The portion of unemployment that is due to the normal working of the labor market; used to denote short-run job/skill matching problems. structural unemployment The portion of unemployment that is due to changes in the structure of the economy that result in a significant loss of jobs in certain industries.
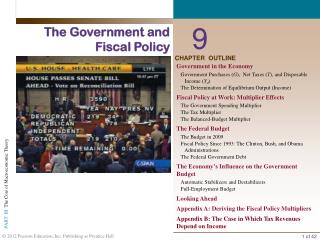
THE LABOR MARKET: BASIC CONCEPTS cyclical unemployment The increase in unemployment that occurs during recessions and depressions. Employment tends to fall when aggregate output falls and to rise when aggregate output rises. A decline in the demand for labor does not necessarily mean that unemployment will rise.
THE CLASSICAL VIEW OF THE LABOR MARKET FIGURE 14.1 The Classical Labor Market
The classical view of the unemployment market is consistent with the following idea: a. The wage rate adjusts to equate the quantity of labor demanded with the quantity of labor supplied; therefore, persistent unemployment above the frictional and structural amount is unlikely. b. If the wage rate in the labor market is too low, people will work for themselves. c. The amount of labor that a firm hires depends on the value of the output that workers produce. d. All of the above.
The classical view of the unemployment market is consistent with the following idea: a. The wage rate adjusts to equate the quantity of labor demanded with the quantity of labor supplied; therefore, persistent unemployment above the frictional and structural amount is unlikely. b. If the wage rate in the labor market is too low, people will work for themselves. c. The amount of labor that a firm hires depends on the value of the output that workers produce. d. All of the above.
THE CLASSICAL VIEW OF THE LABOR MARKET labor supply curve A graph that illustrates the amount of labor that households want to supply at each given wage rate. labor demand curve A graph that illustrates the amount of labor that firms want to employ at each given wage rate.
THE CLASSICAL VIEW OF THE LABOR MARKET THE CLASSICAL LABOR MARKET AND THE AGGREGATE SUPPLY CURVE The classical idea that wages adjust to clear the labor market is consistent with the view that wages respond quickly to price changes. This means that the AS curve is vertical. When the AS curve is vertical, monetary and fiscal policy cannot affect the level of output and employment in the economy.
THE CLASSICAL VIEW OF THE LABOR MARKET THE UNEMPLOYMENT RATE AND THE CLASSICAL VIEW The unemployment rate is not necessarily an accurate indicator of whether the labor market is working properly. The measured unemployment rate may sometimes seem high even though the labor market is working well.
EXPLAINING THE EXISTENCE OF UNEMPLOYMENT STICKY WAGES sticky wages The downward rigidity of wages as an explanation for the existence of unemployment. FIGURE 14.2 Sticky Wages
Refer to the graph below. The meaning of “sticky wages” in this graph refers to: a. The decrease in the equilibrium wage that results after the decrease in demand. b. The failure of the wage rate to fall after the decrease in demand. c. The tendency for the wage rate to rise above W0 after the decrease in demand. d. The decrease in unemployment that results after the decrease in demand.
Refer to the graph below. The meaning of “sticky wages” in this graph refers to: a. The decrease in the equilibrium wage that results after the decrease in demand. b. The failure of the wage rate to fall after the decrease in demand. c. The tendency for the wage rate to rise above W0 after the decrease in demand. d. The decrease in unemployment that results after the decrease in demand.
EXPLAINING THE EXISTENCE OF UNEMPLOYMENT Social, or Implicit, Contracts social, or implicit, contracts Unspoken agreements between workers and firms that firms will not cut wages. relative-wage explanation of unemploymentAn explanation for sticky wages (and therefore unemployment): If workers are concerned about their wages relative to other workers in other firms and industries, they may be unwilling to accept a wage cut unless they know that all other workers are receiving similar cuts.
EXPLAINING THE EXISTENCE OF UNEMPLOYMENT Explicit Contracts explicit contractsEmployment contracts that stipulate workers’ wages, usually for a period of 1 to 3 years. cost-of-living adjustments (COLAs) Contract provisions that tie wages to changes in the cost of living. The greater the inflation rate, the more wages are raised.
EXPLAINING THE EXISTENCE OF UNEMPLOYMENT EFFICIENCY WAGE THEORY efficiency wage theory An explanation for unemployment that holds that the productivity of workers increases with the wage rate. If this is so, firms may have an incentive to pay wages above the market-clearing rate.
The efficiency wage is among the theories of unemployment that explain why: a. Firms tend to pay wages above the wage at which the quantity of labor demanded equals the quantity supplied. b. Firms tend to pay wages below the wage at which the quantity of labor demanded equals the quantity supplied. c. Firms prefer to pay the wage at which quantity supplied equals quantity demanded in the labor market. d. There is only one level of the wage rate at which quantity supplied equals quantity demanded, called the efficiency wage rate.
The efficiency wage is among the theories of unemployment that explain why: a. Firms tend to pay wages above the wage at which the quantity of labor demanded equals the quantity supplied. b. Firms tend to pay wages below the wage at which the quantity of labor demanded equals the quantity supplied. c. Firms prefer to pay the wage at which quantity supplied equals quantity demanded in the labor market. d. There is only one level of the wage rate at which quantity supplied equals quantity demanded, called the efficiency wage rate.
EXPLAINING THE EXISTENCE OF UNEMPLOYMENT IMPERFECT INFORMATION Firms may not have enough information at their disposal to know what the market-clearing wage is. In this case, firms are said to have imperfect information. If firms have imperfect or incomplete information, they may set wages wrong—wages that do not clear the labor market.
EXPLAINING THE EXISTENCE OF UNEMPLOYMENT MINIMUM WAGE LAWS minimum wage laws Laws that set a floor for wage rates—that is, a minimum hourly rate for any kind of labor.
Refer to the figure below. What happens in this labor market if the minimum wage (W0) is abolished? a. Unemployment will rise. b. Unemployment will fall. c. The quantity of labor demanded falls. d. The quantity of labor supplied rises.
Refer to the figure below. What happens in this labor market if the minimum wage (W0) is abolished? a. Unemployment will rise. b. Unemployment will fall. c. The quantity of labor demanded falls. d. The quantity of labor supplied rises.
EXPLAINING THE EXISTENCE OF UNEMPLOYMENT AN OPEN QUESTION The aggregate labor market is very complicated, and there are no simple answers to why there is unemployment.
THE SHORT-RUN RELATIONSHIP BETWEENTHE UNEMPLOYMENT RATE AND INFLATION In the short run, the unemployment rate (U) and aggregate output (income) (Y) are negatively related When Y rises, the unemployment rate falls, and when Y falls, the unemployment rate rises.
THE SHORT-RUN RELATIONSHIP BETWEENTHE UNEMPLOYMENT RATE AND INFLATION This curve represents the positive relationship between Y and the overall price level (P). FIGURE 14.3 The Aggregate Supply Curve
THE SHORT-RUN RELATIONSHIP BETWEENTHE UNEMPLOYMENT RATE AND INFLATION There is a negative relationship between the unemployment rate and the price level. As the unemployment rate declines in response to the economy’s moving closer and closer to capacity output, the overall price level rises more and more, as shown in Figure 14.4. FIGURE 14.4 The Relationship Between the Price Level and the Unemployment Rate
THE SHORT-RUN RELATIONSHIP BETWEENTHE UNEMPLOYMENT RATE AND INFLATION FIGURE 14.5 The Phillips Curve
Which of the following relationships is correct? a. There is a positive relationship between unemployment and output. b. There is a negative relationship between output and the overall price level. c. There is a negative relationship between the unemployment rate and the price level. d. There is a negative relationship between output and employment.
Which of the following relationships is correct? a. There is a positive relationship between unemployment and output. b. There is a negative relationship between output and the overall price level. c. There is a negative relationship between the unemployment rate and the price level. d. There is a negative relationship between output and employment.
THE SHORT-RUN RELATIONSHIP BETWEENTHE UNEMPLOYMENT RATE AND INFLATION inflation rate The percentage change in the price level. Phillips Curve A graph showing the relationship between the inflation rate and the unemployment rate.
THE SHORT-RUN RELATIONSHIP BETWEENTHE UNEMPLOYMENT RATE AND INFLATION THE PHILLIPS CURVE: A HISTORICAL PERSPECTIVE FIGURE 14.6 Unemployment and Inflation, 1960–1969
Policy discussions in the 1960s concerning the Phillips Curve revolved around the issue of: a. What point to choose along a smooth Phillips Curve. b. What to do about a highly unstable Phillips Curve. c. How to maintain low inflation and at the same time lower the unemployment rate. d. How to maintain low unemployment and at the same time lower the inflation rate.
Policy discussions in the 1960s concerning the Phillips Curve revolved around the issue of: a. What point to choose along a smooth Phillips Curve. b. What to do about a highly unstable Phillips Curve. c. How to maintain low inflation and at the same time lower the unemployment rate. d. How to maintain low unemployment and at the same time lower the inflation rate.
THE SHORT-RUN RELATIONSHIP BETWEENTHE UNEMPLOYMENT RATE AND INFLATION FIGURE 14.7 Unemployment and Inflation, 1970—2004
THE SHORT-RUN RELATIONSHIP BETWEENTHE UNEMPLOYMENT RATE AND INFLATION AGGREGATE SUPPLY AND AGGREGATE DEMAND ANALYSIS AND THE PHILLIPS CURVE FIGURE 14.8 Changes in the Price Level and Aggregate Output Depend on Shifts in Both Aggregate Demand and Aggregate Supply
If there is no systematic relationship between inflation and unemployment, it is because: a. The aggregate demand curve shifts, without a shift in the aggregate supply curve. b. Both the aggregate demand and the aggregate supply curve shift simultaneously. c. Neither the aggregate demand nor the aggregate supply curves shift. d. Government policies have effectively eradicated inflation and unemployment.
If there is no systematic relationship between inflation and unemployment, it is because: a. The aggregate demand curve shifts, without a shift in the aggregate supply curve. b. Both the aggregate demand and the aggregate supply curve shift simultaneously. c. Neither the aggregate demand nor the aggregate supply curves shift. d. Government policies have effectively eradicated inflation and unemployment.
THE SHORT-RUN RELATIONSHIP BETWEENTHE UNEMPLOYMENT RATE AND INFLATION The Role of Import Prices FIGURE 14.9 The Price of Imports, 1960 I–2005 II
THE SHORT-RUN RELATIONSHIP BETWEENTHE UNEMPLOYMENT RATE AND INFLATION EXPECTATIONS AND THE PHILLIPS CURVE Expectations are self-fulfilling. This means that wage inflation is affected by expectations of future price inflation. Price expectations that affect wage contracts eventually affect prices themselves. Inflationary expectations shift the Phillips Curve to the right.
Refer to the graph below. The impact of higher inflationary expectations on this Phillips curve is reflected by the move: a. From a to b. b. From a to c. c. From a to d. d. None of the above. Inflationary expectations do not affect the Phillips curve.
Refer to the graph below. The impact of higher inflationary expectations on this Phillips curve is reflected by the move: a. From a to b. b. From a to c. c. From a to d. d. None of the above. Inflationary expectations do not affect the Phillips curve.
THE SHORT-RUN RELATIONSHIP BETWEENTHE UNEMPLOYMENT RATE AND INFLATION IS THERE A SHORT-RUN TRADE-OFF BETWEEN INFLATION AND UNEMPLOYMENT? There is a short-run trade off between inflation and unemployment, but other factors besides unemployment affect inflation. Policy involves much more than simply choosing a point along a nice, smooth curve.
THE LONG-RUN AGGREGATE SUPPLY CURVE, POTENTIAL GDP, AND THE NATURAL RATE OF UNEMPLOYMENT FIGURE 14.10 The Long-Run Phillips Curve: The Natural Rate of Unemployment
THE LONG-RUN AGGREGATE SUPPLY CURVE, POTENTIAL GDP, AND THE NATURAL RATE OF UNEMPLOYMENT natural rate of unemployment The unemployment that occurs as a normal part of the functioning of the economy. Sometimes taken as the sum of frictional unemployment and structural unemployment.
THE LONG-RUN AGGREGATE SUPPLY CURVE, POTENTIAL GDP, AND THE NATURAL RATE OF UNEMPLOYMENT THE NONACCELERATING INFLATION RATE OF UNEMPLOYMENT (NAIRU) NAIRU The nonaccelerating inflation rate of unemployment. FIGURE 14.11 The Long-Run Phillips Curve:The Natural Rate of Unemployment
Refer to the figure below. Which of the following causes a leftward shift in the PP curve? a. A positive change in the rate of inflation. b. A negative change in the rate of inflation. c. An adverse change in input prices. d. A favorable change in input prices.
Refer to the figure below. Which of the following causes a leftward shift in the PP curve? a. A positive change in the rate of inflation. b. A negative change in the rate of inflation. c. An adverse change in input prices. d. A favorable change in input prices.
REVIEW TERMS AND CONCEPTS • cost-of-living adjustments (COLAs) • cyclical unemployment • efficient wage theory • explicit contracts • frictional unemployment • inflation rate • labor demand curve • labor supply curve • minimum wage laws NAIRU natural rate of unemployment Phillips Curve relative-wage explanation of unemployment social, or implicit, contracts sticky wages structural unemployment unemployment rate