Download
1 / 12
120 likes | 237 Views
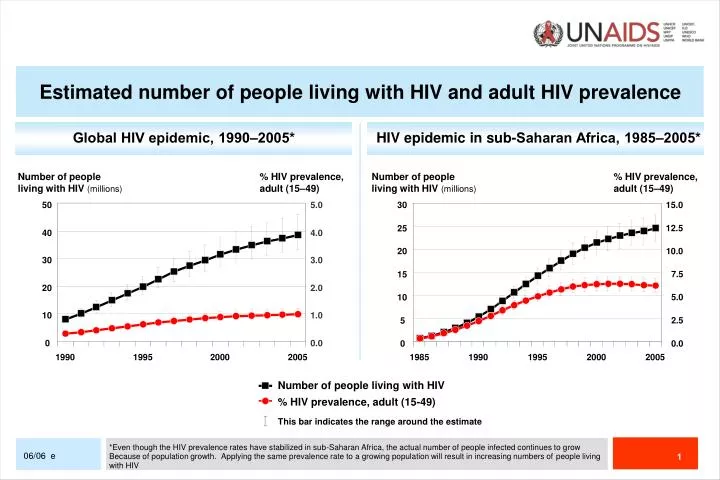
% HIV prevalence, adult (15-49). Estimated number of people living with HIV and adult HIV prevalence. Global HIV epidemic, 1990‒2005*. HIV epidemic in sub-Saharan Africa, 1985‒2005*. Number of people living with HIV (millions). % HIV prevalence, adult (15 ‒ 49). Number of people

E N D
% HIV prevalence, adult (15-49) Estimated number of people living with HIV and adult HIV prevalence Global HIV epidemic, 1990‒2005* HIV epidemic in sub-Saharan Africa, 1985‒2005* Number of people living with HIV (millions) % HIV prevalence, adult (15‒49) Number of people living with HIV (millions) % HIV prevalence, adult (15‒49) 50 5.0 30 15.0 12.5 25 40 4.0 20 10.0 30 3.0 7.5 15 20 2.0 5.0 10 10 1.0 2.5 5 0 0.0 0 0.0 1990 1995 2000 2005 1985 1990 1995 2000 2005 Number of people living with HIV This bar indicates the range around the estimate *Even though the HIV prevalence rates have stabilized in sub-Saharan Africa, the actual number of people infected continues to grow Because of population growth. Applying the same prevalence rate to a growing population will result in increasing numbers of people living with HIV
Regional HIV and AIDS statistics and features, 2003 and 2005 REGION Adults (15+) and children living with HIV Adults (15+) and children newly infected with HIV Adult (15-49) prevalence (%) Adult (15+) and child deaths due to AIDS 2005 2003 2005 2003 2005 2003 2005 2003 Sub-Saharan Africa 24.5 million [21.6‒27.4 million] 23.5 million [20.8‒26.3 million] 2.7 million [2.3‒3.1 million] 2.6 million [2.3‒3.0 million] 6.1 [5.4‒6.8] 6.2 [5.5‒7.0] 2.0 million [1.7‒2.3 million] 1.9 million [1.7‒2.3 million] North Africa and Middle East 440 000 [250 000‒720 000] 380 000 [220 000‒620 000] 64 000 [38 000‒210 000 54 000 [31 000‒150 000 0.2 [0.1‒0.4] 0.2 [0.1‒0.3] 37 000 [20 000‒62 000] 34 000 [18 000‒57 000] Asia 8.3 million [5.7‒12.5 million] 7.6 million [5.2‒11.3 million] 930 000 [620 000‒2.4 million] 860 000 [560 000‒2.3 million] 0.4 [0.3‒0.6] 0.4 [0.2‒0.6] 600 000 [400 000‒850 000] 500 000 [340 000‒710 000] Oceania 78 000 [48 000‒170 000] 66 000 [41 000‒140 000] 7200 [3500‒55 000] 9000 [4300-69 000] 0.3 [0.2‒0.8] 0.3 [0.2‒0.7] 3400 [1900‒5500] 2300 [1300‒3600] Latin America 1.6 million [1.2‒2.4 million] 1.4 million [1.1‒2.0 million] 140 000 [100 000‒420 000] 130 000 [95 000‒310 000] 0.5 [0.4‒1.2] 0.5 [0.4‒0.7] 59 000 [47 000‒76 000] 51 000 [40 000‒67 000] Caribbean 330 000 [240 000‒420 000] 310 000 [230 000‒400 000] 37 000 [26 000‒54 000] 34 000 [24 000‒47 000] 1.6 [1.1‒2.2] 1.5 [1.1‒2.0] 27 000 [19 000‒36 000] 28 000 [19 000‒38 000] Eastern Europe and Central Asia 1.5 million [1.0‒2.3 million] 1.1 million [790 000‒1.7 million] 220 000 [150 000‒650 000] 160 000 [110 000‒440 000] 0.8 [0.6‒1.4] 0.6 [0.4‒1.0] 53 000 [36 000‒75 000] 28 000 [19 000‒39 000] North America, Western and Central Europe 2.0 million [1.4‒2.9 million] 1.8 million [1.3‒2.7 million] 65 000 [52 000‒98 000] 65 000 [52 000‒98 000] 0.5 [0.4‒0.7] 0.5 [0.3‒0.6] 30 000 [24 000‒45 000] 30 000 [24 000‒45 000] TOTAL 38.6 million [33.4‒46.0 million] 36.2 million [31.4‒42.9 million] 4.1 million [3.4‒6.2 million] 3.9 million [3.3‒5.8 million] 1.0 [0.9‒1.2] 1.0 [0.8‒1.2] 2.8 million [2.4‒3.3 million] 2.6 million [2.2‒3.1 million]
A global view of HIV infection 38.6 million people [33.4‒46.0 million] living with HIV, 2005
HIV prevalence (%) among pregnant women attending antenatal clinics in sub-Saharan Africa, 1997/98‒2004 Southern Africa Eastern Africa 50 20 Swaziland United Republic of Tanzania 40 15 Zimbabwe 30 Ethiopia 10 Median HIV prevalence (%) Median HIV prevalence (%) 20 Kenya South Africa Mozambique 5 10 0 0 1997‒ 1998 1999‒ 2000 2001 2002 2003 2004 1997‒ 1998 1999‒ 2000 2001 2002 2003 2004 West Africa 20 15 Note: Analysis restricted to consistent surveillance sites for all countries except South Africa (by province) and Swaziland (by region) 10 Median HIV prevalence (%) Côte d'Ivoire Burkina Faso 5 Ghana Senegal 0 1997‒ 1998 1999‒ 2000 2001 2002 2003 2004 Sources: Ministry of Health (Mozambique); Department of Health (South Africa); Ministry of Health and Social Welfare (Swaziland); Ministry of Health and Child Welfare (Zimbabwe); Adapted from Asamoah-Odei, et al. HIV prevalence and trends in sub-Saharan Africa: no decline and large subregional differences. Lancet, 2004 (Ethiopia); Ministry of Health—National AIDS/STD Control Programme (Kenya); Ministry of Health (United Republic of Tanzania); Conseil national de lutte contre le sida et les IST (Burkina Faso); Centers for Disease Control and Prevention (CDC)—GAP—Côte d'Ivoire (Côte d'Ivoire); Ghana Health Service (Ghana); Conseil National de Lutte Contre le SIDA (Senegal).
2005 Country progress towards 2001 Declaration of Commitment on HIV/AIDS—Global targets (low- and middle-income countries) [First of 2 slides] GLOBAL RESULTS 2005 GLOBAL TARGETS 2005 Total annual expenditure* US$ 8 297 000 000 Estimated range: US$ 7.5 billion‒US$ 8.5 billion US$ 7.0 billion‒US$ 10.0 billion Global target achieved Percentage of youth aged 15‒24 who correctly identify ways of preventing HIV transmission and who reject major misconceptions about HIV transmission** MALE: 33% (Country range: 7%‒50% coverage), (n=16) FEMALE: 20% (Country range: 8%‒44% coverage), (n=17) 90% coverage No country achieved this Percentage of HIV-positive pregnant women receiving antiretroviral prophylaxis*** 9% (Country range: 1%‒59% coverage), (n=41) 80% coverage No country achieved this Percentage of people with advanced HIV infection receiving antiretroviral therapy**** 20% (Country range: 1%‒100% coverage), (n=116) 1 300 000 people on treatment 50% coverage (3 million people on treatment) 21 countries achieved this Global target not achieved * See ‘Financing’ chapter ** Demographic and Health Survey/AIDS Indicator Survey, 2001‒2005 (MEASURE DHS, 2006) *** Stover et al. (2006) **** “3 by 5” Report (WHO/UNAIDS, 2006)
2005 Country progress towards 2001 Declaration of Commitment on HIV/AIDS—Global targets (low- and middle-income countries) [Last of 2 slides] GLOBAL RESULTS 2005 GLOBAL TARGETS 2005 Percentage of young males and females, aged 15‒24, who are HIV infected***** MALES: 1.4% (Measure of uncertainty: 1.1%‒1.8%), (n=54) FEMALES: 3.8% (Measure of uncertainty: 3.0%‒4.7%), (n=54) No comparable global data on this age cohort is available from 2001. Progress towards target can only be measured in individual countries. 25% reduction in most affected countries 6 of the most affected countries achieved this Estimated percentage of infants born to HIV-infected mothers who are infected in 2005****** 26% of infants born to HIV-infected mothers were also infected (n=33 most affected countries) In 2001, approximately 30% of infants were infected. There has been an estimated 10% reduction in HIV transmission between 2001 and 2005. 20% reduction 11 of the most affected countries achieved this ***** UNAIDS/WHO 2005 Estimates for countries with generalized epidemics ****** UNAIDS/WHO 2005 Estimates
Comparison of 2003 and 2005 data on the coverage of antiretroviral therapy, access to mother-to-child prevention services and coverage of HIV-infected mothers who received antiretroviral prophylaxis to prevent mother-to-child transmission Access to mother-to-child prevention services (all pregnant women) Coverage of HIV-infected mothers who received antiretroviral prophylaxis Coverage of antiretroviral therapy 25 25 25 20.0 20 20 20 15 15 15 % % % 9.2 9.0 10 10 10 7.6 7.0 5 5 5 3.3 0 0 0 2003 2005 2003 2005 2003 2005 Sources: WHO/UNAIDS (2006). Progress on global access to HIV antiretroviral therapy: a report on “3 by 5” and beyond; USAID et al. (2006). Coverage of selected services for HIV/AIDS prevention, care and support in low and middle income countries in 2003 and 2005.
Percentage of young people aged 15‒24 reporting the use of a condom during sexual intercourse with a non-regular partner, Sub-Saharan Africa, 2001‒2005 Benin 2001 Botswana 2001 Countries with date of survey indicated Burkina Faso 2003 Cameroon 2004 Chad 2004 Ghana 2003 Guinea 2005 Kenya 2003 Lesotho 2004 Madagascar 2003 Malawi 2004 Mali 2001 Mozambique 2003 Nigeria 2003 Rwanda 2004 Senegal 2005 United Republic of Tanzania 2003 Uganda 2004 Zambia 2003 0 10 20 30 40 50 60 70 80 90 100 % Female Male Sources: Demographic Health Surveys; HIV/AIDS Indicator Surveys (2001-2005)
Estimated total annual resources available for AIDS, 1996‒2005 9000 • Data include: • International donors, domestic spending (including public spending and out-of-pocket expenditures) • International Foundations and Global Fund included from 2003 onwards, PEPFAR included from 2004 onwards • * Projections based on previous pledges and commitments (range of the estimation: US$7.5 to US$8.5 billion). Signing of Declaration of Commitment on HIV/AIDS 8297* 8000 7000 6000 5000 US$ million 4000 3000 2000 1623 1000 292 0 1996 1997 1998 1999 2000 2001 2002 2003 2004 2005
AIDS funding requirements for low- and middle-income countries US$ billion 2006 2007 2007 2006‒2008 Prevention 8.4 10.0 11.4 29.8 Care and treatment 3.0 4.0 5.3 12.3 Support for orphans and vulnerable children 1.6 2.1 2.7 6.4 Programme costs 1.5 1.4 1.8 4.6 Human resources 0.4 0.6 0.9 1.9 TOTAL 14.9 18.1 22.1 55.1 Source: UNAIDS (2005). Resource needs for an expanded response to AIDS in low- and middle-income countries.
Distribution by region of the funding required for prevention Latin America/Caribbean: 9% Eastern Europe: 12% North Africa/Middle East: 3% Africa: 29% South/South-East Asia: 21% East Asia/Pacific: 26% Source: UNAIDS (2005). Resource needs for an expanded response to AIDS in low- and middle-income countries.
Distribution by region of the funding required for treatment and care Latin America/Caribbean: 17% Eastern Europe: 7% North Africa/Middle East: 1% Africa: 55% South/South-East Asia: 4% East Asia/Pacific: 16% Source: UNAIDS (2005). Resource needs for an expanded response to AIDS in low- and middle-income countries.