Download
1 / 42
420 likes | 517 Views
Analyzing digital images for classroom environmental research Mort Sternheim and Rob Snyder STEM Education Institute University of Massachusetts Amherst NSF DRL-1031115. Today’s agenda. Introduction to Color Basics and Analyzing Digital Images (Rob)

E N D
Analyzing digital images for classroom environmental research Mort Sternheim and Rob Snyder STEM Education Institute University of Massachusetts Amherst NSF DRL-1031115
Today’s agenda • Introduction to Color Basics and Analyzing Digital Images (Rob) • Some examples of using a digital camera as a scientific instrument (Mort) • Today’s materials (and much more) are available at the UMass Stem Education Institute web site at: www.umassk12.net/digital/materials.html
The Big Idea • Digital cameras and computers are widely available for students and teachers. However, they are mainly used for documentation: creating PPT presentations, handouts, posters, etc. • STEM DIGITAL shows how digital image analysis can be applied to environmental (and other) research in STEM courses • Application to studies of air quality, water quality, arsenic contamination • Other examples from climate change, diffusion …
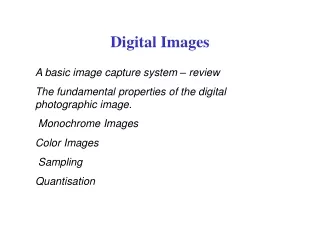
Analyzing Digital Images Software • Developed by John Pickle, Concord Academy (formerly at the Museum of Science, Boston) • Free, student friendly, for Windows and Mac • Color and digital image basics • Spatial, intensity, spectral, temporal analysis tools • Updated by Dan Gullage, STEM Ed • ADI (today’s version): www.umassk12.net/adi • Newer version: http://www.globalsystemsscience.org/software/download
Summer Institutes • June 25 - 29, 2012 at UMass Amherst • Middle/High School STEM teachers; teams • Participants MUST bring a digital camera, and are encouraged to bring a laptop computer • Stipends ($375 summer), materials, parking, lunches • Housing for those outside the commuting radius • 3 graduate credits available at reduced cost; free PDP's (Professional Development Points) • Summer 2013: Online grad course
Academic year component • Online support via Moodle, email • Kit with key materials for air quality, arsenic, water quality collaborative projects • Additional 3 credit reduced cost option or free PDP’s • Additional $300 stipend • $200 budget for classroom materials
What ADI can measure • Geometry • Area, length, angles • Intensity • Color (RGB spectral analysis) • Time evolution • Moving objects • Growing or changing organisms, ecosystems • Use images from digital cameras, remote sensing web images
We used inexpensive spotlights to mix Red, Green and Blue light and produced interesting results A wide variety of devices that mix red, green and blue light are available.
Primary and complementary colors of light are commonly illustrated in this fashion. Note: Any 3 colors from three different regions of the visible spectrum can be chosen as primary colors.
Human Eyes Have Photoreceptors • Our eyes have two main types of photoreceptors, rods and cones. These cells are in the retina, a layer at the back of the eye. • Cones allow us to see colors. They less sensitive than the rods and only work in bright light. • Rods let us see in dim light and show the world to us in black and white. This is why you see only black and white outside at night or in a dimly lit room.
L cones have a peak detection of greenish-yellow. M cones have a peak detection of green . S cones detect principally blue and violet colors. The letters L, M and S refer to Long, Medium, and Short Wavelengths
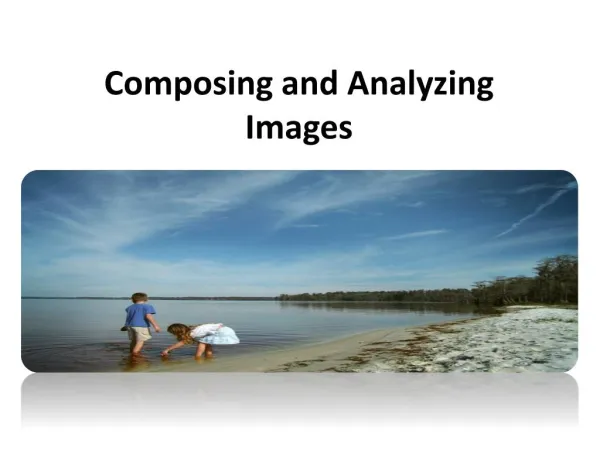
Our brain detects a wide range of colors by analyzing the data it receives from cones on the retina. The ADI software in a computer analyzes data it receives from sensors in a camera. The ADI Software/Brain Analogy
The Eye/Digital Camera Connection A digital camera is similar in many respects to our eyes. Digital cameras have sensors that also detect the intensities of light in the red, green, and blue ranges of the electromagnetic spectrum.
Our eyes and digital cameras detect light in the red, green and blue portions of the spectrum that has been reflected from an object • Blue surfaces are mostly detected by the camera’s blue sensor • Green surfaces are mostly detected by the camera’s green sensor • Red surfaces are mostly detected by the camera’s red sensor • But yellow surfaces will be detected by the green and the red sensors
ADI can produce a graph of colors along a line to reveal changes in a color.
The ADI rectangle tool can analyze an area. Average Intensities: Red = 62%, Green = 49%, Blue = 34% Yellow is a difficult color to create with inexpensive lights.
Pixels • A pixel is a “picture element”, smallest block of color in a digital picture or on a computer monitor. The more pixels, (usually) the better the image.
An intensity example: albedo • In polar regions, when snow or sea ice melts exposing tundra or water, more sunlight is absorbed. • This decrease in the fraction reflected or albedo provides positive feedback, increasing warming trends • You can measure ratio of albedo to that of a standard, e.g., white Xerox paper • Albedo of white Xerox paper is about 0.5
Color • Today • Water quality • Carbon dioxide measurements • Website: Arsenic in water, rice, pressure treated wood… • Health of plants – effects of nutrients, pollutants …
Color example: Water quality • Volatile organic matter from decaying plants must be removed from water supplies • Treatments use activated charcoal, alum, chlorine, “home or recreational treatment” ( 1 to 4)
Some research questions • How much alum, etc., do you need? • Want kind of leaf material would leach the most organic matter? • Old dry leaves or young green ones? Coniferous or deciduous? Oak or maple? Tree or grass? Large leaves or small ones? • Does light matter? • Does the time in the water matter? • Does frequent mixing matter? Does oxygen matter? • Is there is a difference between distilled and highly mineralized water?
More water quality research questions • What is the effect of • pH • Salinity • Temperature • Particle size • Amount of sunlight on the process of leaching?
Another color example: CO2 • pH BTB indicator (bromothymol blue) changes color from blue to yellow as the acidity increases • Good for measuring ~ neutral pH (7.6 to 6.0). Used to observe photosynthetic and respiratory activity. • CO2 bubbled in BTB solution makes carbonic acid, changes color • Use diluted solution (6 ml 0.04% plus 90 ml water) • Blow up balloon, use syringe to measure 50 ml, inject into water • Compare control, room air, breath; breath after exercise
Carbon dioxide research ideas • Test pure CO2.made with baking soda, vinegar • Test car exhausts • Investigate variations in atmospheric CO2 levels: urban, rural, roadways; well ventilated spaces, stuffy classrooms, etc. • Investigate reduction of CO2 levels due to photosynthesis • Investigate increase in CO2 levels due to combustion • Investigate response of various plants to increased CO2 levels
Geometry • Areas • Leaf, leaf cover • Polar ice • Hands, feet, bodies of water … • Length • Tree growth • Solar areole – correlation with aerosols • Diffusion • Angles • Size of the earth – Eratosthenes: • Tree or plant branches
Area measurement: Polar ice • Arctic cycle – max in March, min in Sept. • Shrinkage over the past 30 years • Compare / contrast Arctic, Antarctic annual sea ice cycles, changes over past 30 years Sept. 2009 Sept.1979
Trees – areas, lengths, angles 5/5/11 5/8/11 5/14/11 5/26/11
Length example: solar aureole • Solar aureole is a bright glow around the sun • Caused by aerosols – suspensions of fine particles or liquid drops in the air • Aerosols are usually dust, smoke, smog • Aureole is larger when the concentration is higher • Rain will tend to wash out aerosols • ADI can quantify aureoles and provide air quality data
Eratosthenes Calculated Earth’s Circumference over 2000 years ago Distance/Circumference = Angle / 360 An ADI angle tool can measure an angle formed by a post and it’s midday shadow. That Angle and distance to a location with no midday shadow can be used to calculate Earth’s circumference.