Download
1 / 1
10 likes | 125 Views
This study investigates the effects of elevated CO2 levels on microbial community composition in the rhizosphere of poplar trees. Through 16S and 18S rDNA classification analysis using the RDP-II classifier, we analyze the sequences to classify diverse microbial genera. Our findings reveal substantial distances in edit percentages among classified sequences, indicating potential misclassifications and uncertainties within specific genera. We calibrated alignment parameters to enhance classification accuracy, assessing similarities through global alignment techniques. This work provides valuable insights into microbial responses to climate change.

E N D
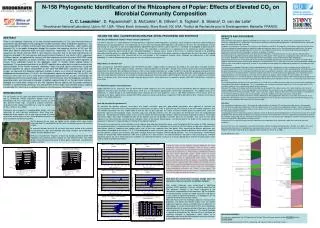
N-158 Phylogenetic Identification of the Rhizosphere of Poplar: Effects of Elevated CO2 on Microbial Community Composition C. C. Lesaulnier1, D. Papamichail2, S. McCorkle1, B. Ollivier3, S. Taghavi1, S. Skiena2, D. van der Lelie11Brookhaven National Laboratory, Upton, NY, USA. 2Stony Brook University, Stony Brook, NY, USA. 3Institut de Recherche pour le Developpement, Marseille, FRANCE. 16S AND 18S rDNA CLASSIFICATION ANALYSIS, INITIAL PROCESSING AND STATISTICS How does the Ribosomal Database Project classify sequences? The RDP-II classifier is a naïve Bayesian classifier based on vetted 16S rDNA sequences, including a small number of sequences representing taxa belonging to uncultured organisms. The frequencies of all sixty-four thousand possible eight-base sub-sequences (8-mers) are calculated and used as the training set sequences in each of the approximately 880 different genera. When a query sequence is submitted, the probability of observing all 8-mers in the query is calculated separately for each genus. This calculation is carried out as a comparison to the training set and the sequence is assigned to a particular genus based on the calculated probability. In actuality, only a subset of the 8-mers is randomly selected in the probability calculation and the process is repeated 100 times. Confidence in the assignment of the query sequence is based upon the most commonly assigned genus in the bootstrap trials. One characteristic of this classification is the confidence estimate which, although not representing a well formed probability, is useful in determining which results we can trust and base our analysis on. Why it does not convince us? After classifying our 16S rDNA sequences with the RDP-II classifier, a large number of sequences classified in the same genus had edit distances accounting for >20% the total sequence length, sometimes reaching distances of up to 50%. Though many of these occurrences were found between sequences classified with low confidence estimates (< 50%), they created uncertainty for a large number of classification groupings and gave the first clue that many of the sequences we were trying to classify were distant from all the vetted sequences available. Secondly, certain groups of sequences with >97% edit distance similarity to any member of another group were found classified in different genera, families, etc., with a couple of occurrences even in the phylum level. Such closely related sequence group schisms were found even in sequences groups within 99% edit distance similarity to each other. Full Alignment against vetted sequences. Global alignment of our sequences with the 5574 RDP-II vetted sequences was then carried out using the Needleman-Wunsch algorithm for global alignment, with the (match, mismatch, ins/del) values set to (0, 1, 1) and no other gap penalties (Levenshtein edit distance). This algorithm with O(n^2) complexity, is simple enough in its implementation to be relatively fast for small fragments, such as 16S rRNA sequences. These results were still troubling as the great majority of the sampled 16S rRNA sequences had an edit distance ranging from 150 to 300 (90% to 80% similarity) to the closest match in the vetted sequences. How did we adjust the parameters? To maximize classification accuracy using blast, the (match, mismatch, gap_start, gap_extend) parameters were adjusted to minimize the misclassifications within the RDP-II vetted sequences. Focusing on the genus level, a leave-one-out test for each of the 5574 vetted sequences with nine different parameter sets was implemented to find the one set that separates the scores of closely related species to distant ones. Since the parameter space for the quadruple match, mismatch, gap_start, and gap_extend is vast, the calculations for testing each case are computationally expensive. We designed a limited number of test cases to explore the most plausible solutions which had naturally imposed restrictions. Only highly conserved regions that match exceptionally well will be aligned, and will not provide a concrete basis for classification. The score for each blast alignment was constructed by summing up the individual scores of the locally aligned pieces, normalized against the length of the sequences being compared. It represents the percentage of similarity of the aligned fragments. The two tests to measure the misclassifications and to calibrate local alignment parameter space, were the following (i) The number of rRNA sequences that score better against a sequence from another genus than against all of the sequences in their genus. (ii) The number of ribosomal sequences that score better against a sequence from another genus than at least one sequence from their genus. After examining the different parameter sets constructed, we decided on the values (1, 5, 3, 2.5 corrosponding to match, mismatch, gap_open, and gap_extend respectively) where match is positive and considered a reward, and mismatch, gap_open and gap_extend are negative and considered penalties. This set of parameters minimized the number of misclassified vetted sequences from 274 to 229 out of a total of 5574. The constructed blast classifier is now classifying an unknown sequence against the set of vetted sequences available and selecting the highest scoring sum of locally aligned pieces and the resulting score is then used to create a confidence estimate. RESULTS AND DISCUSSION 16S rRNA There are three major phyla of bacteria affected by the change in CO2 concentration: the Acidobacteria, Actinobacteria and the Firmicutes. Although there is a significant increase observed within the Actinobacteria population, a significant decrease is observed within the Acidobacteria and Firmicutes. It appears that among the Firmicutes those that are most affected are low G+C Gram positive Clostridiales, along with the Bacillales. The most significantly impacted genera respectively representing these orders are the Desulfotomaculum and Bacillus, the former being comprised of only anaerobic bacteria. For the later, the metabolic characteristics need to be determined by phylogenetic proximity as they may be strict anaerobes, facultative anaerobes or aerobes. Although we observe a significant decrease in gram positive Firmicutes, a significant increase in gram positive Actinobacteria is observed comprising predominantly of species belonging to Arthrobacter. These organisms are obligate aerobes commonly found in soils and can degrade a variety of chlorinated and aromatic hydrocarbons and may be related to lignin degradation. A population decrease has not only been observed among the anaerobic gram positive Firmicutes but also within the aerobic gram negative Acidobacteria where the only genus detected is Acidobacterium. This is surprising as they are chemoorganotrophs capable of utilizing sugars and could be explained as a factor of out-competition among bacteria, predominantly between the Acidobacteria and Actinobacteria. The decrease in anaerobic Firmicutes (sulfate reducing bacteria) and the subsequent increase in aerobes can be related to the increased oxygenation of the soil environment. In the course of this study, sulfate reducers were found among the Clostridia and within the delta-Proteobacteria. In this study we found that there was no quantitative variation in community composition among the delta-Proteobacteria. The Clostridia however showed a significant decrease in its Desulfotomaculum population. This Desulfotomaculum population decrease can be related to a sensitivity of these bacteria to oxygen. It been noted that some members of the delta-Proteobacteria are less sensitive to oxygen as they were able to grow in the presence of oxygen under microaerophilic conditions. This metabolic characteristic has never been noted among the Desulfotomaculum and because of this it is an interesting avenue worthy of pursuing. For Desulfotomaculum the high levels of atmospheric CO2 should have resulted in the observation of an increase of this population as they predominantly grow autotrophically. This as stated above was not observed and our hypothesis is that increased levels of CO2 resulted in oxidative stress inhibiting the growth of these bacteria. Along with the carbon and nitrogen cycle more attention has to be paid to the sulphur cycle as the sulfate reducers were found to comprise approximately 15% of the total population. The majority of these organisms are only capable of oxidizing organic substrates in the presence of the electron acceptors sulfate, sulfite, thiosulfate, sulphur. However when these electron acceptors are depleted in the environment Methanoarchaea may act as hydrogen scavengers oxidizing the organic substrates used by SRB. It is therefore important to further analyse the archaeal (Methanoarchaea) populations within this soil in order to confirm the results obtained for Desulfotomaculum. It is suspected that the importance of these archaea should mirror that of the Desulfotomaculum as they are mostly autotrophs and equally as sensitive to oxygen. 18S rRNA The only phylum studied at present is the fungi and under conditions of elevated CO2 we observed a decrease in Ascomycetes. The Basidomycete population importance remained stable however with certain internal population changes. These included the increase of the Homobasidomycetes (Boletus) and a decline in the Heterobasidomycetes (Auricularia) along with the disappearance of the Tremellomycetidae (Tremella). It would appear that an ectomychorrizal genus (Boletus) comes to dominate the fungal population in the presence of CO2. This can be attributed to the fact that under conditions of elevated CO2 the trees fine root biomass increases significantly and potentially favorizes the symbiotic relationship with this ectomychorrizal fungi resulting in the out-competing of saprophytic and other ectomychorrizal fungi to the extend of which some species no longer survive. Quantitative PCR using DSR specific primers to determine the importance of this community under these two environmental conditions. Elevated CO2 alters the composition of microbial communities without changing microbial biomass (Phillips et al, 2002). It has also been found that decreases in Gram positive and proportional increases in Gram negative bacteria have been found to occur in cellobiose-amended soil beneath plants growing under elevated CO2 (Bruce et al, 2000). Include qPCR plans here. ABSTRACT There is considerable uncertainty as to how elevated concentrations of CO2 and increased levels of concomitant root development and subsequent exudate secretion affects rhizosphere populations. Our study compared the variability in prokaryotic and eukaryotic community composition, under ambient and elevated CO2, in the poplar rhizosphere through the creation and sequence analysis of 16S and 18S rRNA gene libraries containing 3000 and 2500 sequences, respectively. For the analysis of the 16S sequences we initially used the RDP II naive Bayesian classifier. Due to the large edit distances of sequences grouped in the same genera and several misclassifications of very similar (>97%) sequences in different groups, we optimized the analysis with local alignment statistics, based on 5600 RDP-vetted 16S rRNA gene sequences of known taxonomy. For that purpose we used the BLAST algorithm to classify these sequences based on the aggregate scores of multiple locally aligned pieces of significance. The parameters/penalties of the BLAST algorithm were adjusted in an effort to minimize the misclassification of the known taxonomy sequences, when classified against themselves. Using the optimized algorithm for species classification on the 1500 16S rRNA gene sequences from each soil sample, we observed the following significant changes in phyla as a result of elevated CO2 levels: Acidobacteria decreased from 10% to 5%, the Actinobacteria community doubled from 10% to 20%, the Firmicutes went from 10% to 4%, while the Verrucomicrobia halved from 5% to 2.5%. Interestingly, the Proteobacteria community stayed stable at 50% of the total community, while the proportions between its respective orders also remained unchanged. In addition, approximately 6% of the community members belonged to 6 novel phyla. Analysis of the 18S sequence data to address the Eukaryotic community members is currently being carried out. Our work presents the first large scale, detailed analysis showing that elevated CO2 levels have a significant impact on the rhizosphere community composition. INTRODUCTION The soil samples for this study were obtained from the free-air CO2 and O3 enrichment (FACE) experiment located 25km west of Rhinelander, WI. This multi-variant experiment consists of twelve 30m diameter FACE rings, assigned to factorial treatments of atmospheric CO2 (ambient and 522.7μL/L) and O3 (ambient and 54.5nL/L: Dickson et al, 2000). Treatments are arranged in a complete block design, with three replications of each treatment combination. Each Face ring is divided into three sections: half of each ring consisted of Populustremuloides and the other half was further divided into quarters with Acersaccharum and BetulaPapyrifera. For the purpose of our study we looked at soil samples which were treated under elevated CO2 collected during the fourth full growing season after planting in 1997. To measure microbial diversity 10 soil cores from each section of the ambient and elevated CO2 rings were collected and mixed. Samples were collected in random locations between trees. DNA was extracted from 10 grams of each soil sample, purified and the PCR amplified using universal primers specific for 16S and 18S rDNA. Four rDNA libraries were constructed for each of these genes under both environmental conditions tested. Using the value of the highest scoring alignment for each sequence, and setting the Boolean value to genus, family, order, class or phylum we determined if the classification was correct (0) or incorrect (1). We created a confidence estimate for each blast alignment score. Since many of these sequences do not have corresponding score, regression curves were used to approximate their values. We use polynomial regression of the 4th degree, smoothed by addition of extra points, representing high confidence estimates at very high scores and zero confidence estimates at very low scores. The unsmoothed regression curves and the classification score confidence estimates are shown in the figure. The confidence estimate now of each score is calculated from the value of the polynomial for this score. How does the classification accuracy change when the threshold of what we consider acceptable changes? Two serious challenges were encountered in identifying unknown rRNA sequences from our sampling experiment (i) The sequence similarity is not always congruent to the taxonomical categorization of the sequences. (ii) The limitation of reference points (number of vetted sequences) and biases in the number of represented groups (i.e. pathogens) are not reflective of the diversity found in nature. With reference to the first challenge, organisms having similar properties and falling into specific groups may still contain sequence fragments closely resemble those of organisms in other groups. It is worth mentioning that 62% of the sequences aligned better with a sequence outside of their genus than with some sequence in their assigned genus. The second challenge is somewhat alleviated by the fact that we are searching for significant changes in populations, which allows us to extrapolate ratios either by eliminating low score classifications or by combining classifier results. ACKNOWLEDGEMENTS This work was supported by the US Department of Energy, Office of Science, project number XXXXXXX entitled “XXXXXXXXXX”. The Joint Genome Institute for all of the sequencing, with special thanks to Jan-Fang Cheng.