Download
1 / 6
60 likes | 221 Views
Raman Water Vapor Lidar Cal/Val Mission within NDACC David Whiteman, Code 612, NASA GSFC Demetrius Venable, Howard University, Washington, DC Robert Sica, U. Western Ontario, London, Ontario.

E N D
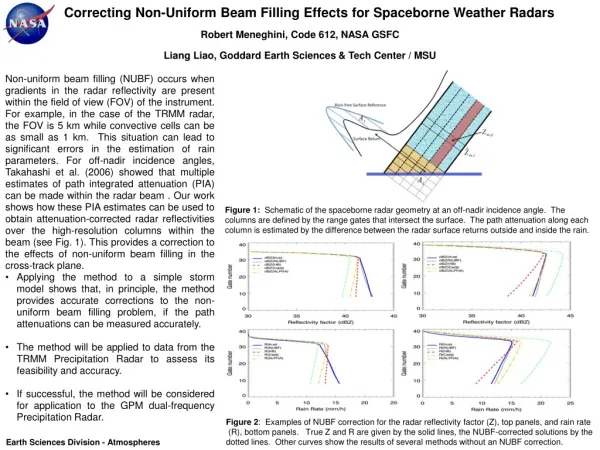
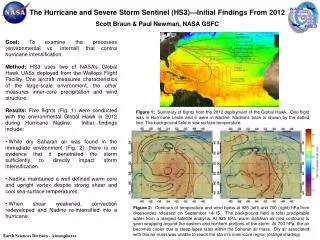
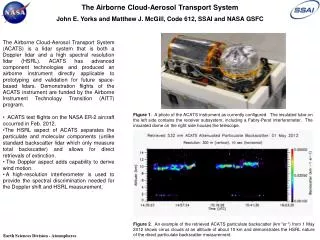
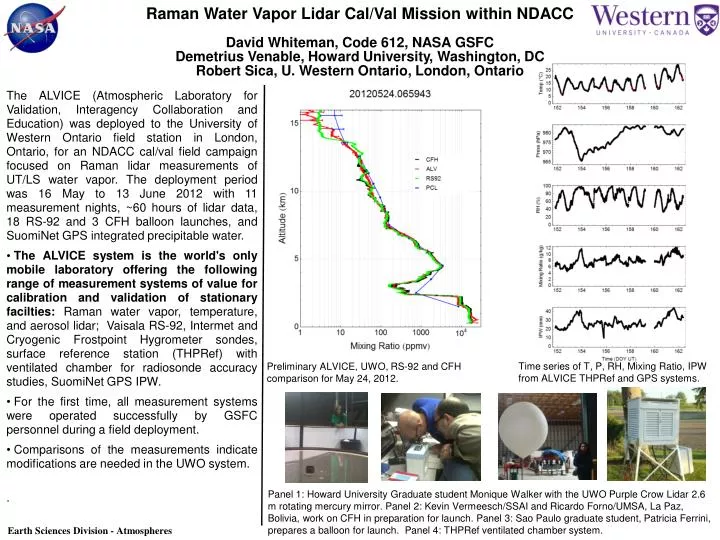
Raman Water Vapor Lidar Cal/Val Mission within NDACC David Whiteman, Code 612, NASA GSFC Demetrius Venable, Howard University, Washington, DC Robert Sica, U. Western Ontario, London, Ontario The ALVICE (Atmospheric Laboratory for Validation, Interagency Collaboration and Education) was deployed to the University of Western Ontario field station in London, Ontario, for an NDACC cal/val field campaign focused on Raman lidar measurements of UT/LS water vapor. The deployment period was 16 May to 13 June 2012 with 11 measurement nights, ~60 hours of lidar data, 18 RS-92 and 3 CFH balloon launches, and SuomiNet GPS integrated precipitable water. • The ALVICE system is the world's only mobile laboratory offering the following range of measurement systems of value for calibration and validation of stationary facilties: Raman water vapor, temperature, and aerosol lidar; Vaisala RS-92, Intermet and Cryogenic Frostpoint Hygrometer sondes, surface reference station (THPRef) with ventilated chamber for radiosonde accuracy studies, SuomiNet GPS IPW. • For the first time, all measurement systems were operated successfully by GSFC personnel during a field deployment. • Comparisons of the measurements indicate modifications are needed in the UWO system. . Time series of T, P, RH, Mixing Ratio, IPW from ALVICE THPRef and GPS systems. Preliminary ALVICE, UWO, RS-92 and CFH comparison for May 24, 2012. Panel 1: Howard University Graduate student Monique Walker with the UWO Purple Crow Lidar 2.6 m rotating mercury mirror. Panel 2: Kevin Vermeesch/SSAI and Ricardo Forno/UMSA, La Paz, Bolivia, work on CFH in preparation for launch. Panel 3: Sao Paulo graduate student, Patricia Ferrini, prepares a balloon for launch. Panel 4: THPRef ventilated chamber system. Earth Sciences Division - Atmospheres
Name: David Whiteman, NASA/GSFC, Code 612, Howard University Adjunct Professor of Physics E-mail: david.n.whiteman@nasa.gov Phone: 301-614-6703 References: Whiteman, D. N., K. C. Vermeesch, L. D. Oman, and E. C. Weatherhead, 2011a: The relative importance of random error and observation frequency in detecting trends in upper tropospheric water vapor, Journal of Geophysical Research, 116, D21118, doi:10.1029/2011JD016610 D. N. Whiteman, M. Cadirola, D. Venable, M. Calhoun, L. Miloshevich, K. Vermeesch, L. Twigg, A. Dirisu, D. Hurst, E. Hall, A. Jordan, and H. Vömel, 2011b: Correction technique for Raman water vapor lidar signal dependent bias and suitability for water vapor trend monitoring in the upper troposphere, Atmospheric Measurement Techniques Discussion, 4, 7337-7403, doi:10.5194/amtd-4-7337-2011 Whiteman, D. N., K. Rush, S. Rabenhorst, W. Welch, M. Cadirola, G. McIntire, F. Russo, M. Adam, D. Venable, R. Connell, I. Veselovskii, R. Forno, Bernd Mielke, B. Stein, T. Leblanc, S. McDermid, and H. Vömel, 2010: Airborne and Ground-based measurements using a High-Performance Raman Lidar. Journal of Atmospheric and Oceanic Technology, 27, 1781-1801, doi: 10.1175/2010JTECHA1391.1 Data Sources: NASA/GSFC ALVICE Raman lidar, UWO Purple Crow Raman Lidar, Vaisala RS-92, Cryogenic Frostpoint Hygrometer, SuomiNet GPS, Rotronics and Vaisala T and RH sensors, Paroscientific P sensor Technical Description of Figures: The ALVICE mobile laboratory has a unique suite of instrumentation for field measurements of water vapor, temperature, aerosols, and clouds. In addition to an advanced Raman lidar system that has demonstrated what is likely the highest sensitivity to upper tropospheric and lower stratospheric water vapor of any Raman lidar, ALVICE contains ground stations for Vaisala RS-92, Intermet and Cryogenic Frostpoint Hygrometer (CFH) radiosondes. The CFH is one of the recognized reference systems for upper tropospheric and lower stratospheric water vapor measurements. The ALVICE system is the only mobile laboratory that combines the CFH measurement capability with those of a Raman lidar. ALVICE also carries into the field the only “rover” in the international SuomiNet GPS network for measurements of integrated precipitable water. Furthermore, there is a surface reference station that supplies NIST traceable measurements of T, P and RH and possesses a ventilated chamber for pre-launch characterization of radiosonde accuracy. The complement of measurement systems contained within ALVICE provides redundant information for intercomparisons and validation of other atmospheric profiles such as the Raman lidar at the University of Western Ontario. No other mobile system in the world offers this suite of measurement capability for calibrating and validating other water vapor profiling instrumentation. Scientific significance: Water vapor is the strongest greenhouse gas in the atmosphere and the most variable state parameter. It governs numerous atmospheric processes and is anticipated to increase in concentration in the atmospheric due to climate change. Water vapor in the upper troposphere and lower stratosphere (UT/LS) is particularly effective in modulating the atmospheric radiation budget. Predicting the consequences of these changes in water vapor amount are of great importance to society so work is needed in monitoring these changes. NDACC Raman water vapor lidar is tasked with providing quality data for monitoring these atmospheric trends and also for satellite validation. The ALVICE mobile laboratory possesses a unique suite of instrumentation enabling it to contribute to validation of other instruments within NDACC and satellites and also providing climate quality data on its own. Relevance for future science and relationship to Decadal Survey: Current and future missions will focus on both profile and total column water measurements for which accurate validation data will be desired. Earth Sciences Division - Atmospheres
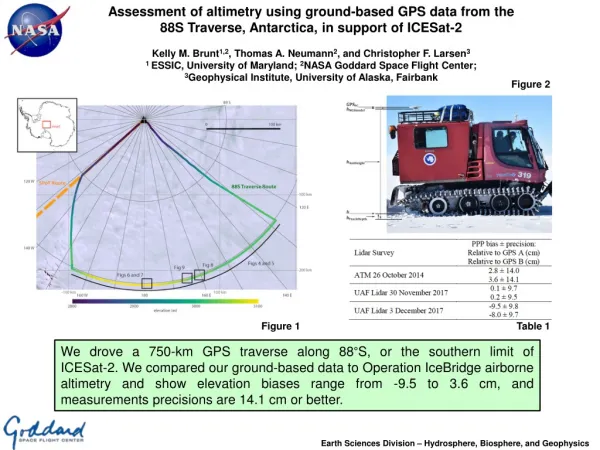
Dust Direct Radiative Effects on the Study of Regional Climate Variation: A LW Assessment Hansell, R.A., S.C. Tsay, N.C. Hsu, Q. Ji, S.W. Bell, B.N. Holben, E.J. Welton T.L. Roush, W. Zhang, J. Huang, Z. Li, and H. Chen, An assessment of the surface longwave direct radiative effect of airborne dust in Zhangye, China, during the Asian Monsoon Years field experiment (2008), J. Geophys. Res. 2012 LW Fig. 1. Aqua MODIS Deep Blue averaged AOT (0.55m) from 30 April - 6 May 2008 over measurement site in Zhangye (marked by X). Gobi Desert X Taklamakan Desert Fig. 2. MODIS true-color image acquired by EOS Aqua showing dust aerosols passing through Zhangye (marked by yellow star) Fig. 3. LW surface DARE (Wm-2) of Asian dust is ~2X greater than that of African dust. SW Fig. 4. Diurnally averaged SW DARE forcing efficiency at Zhangye. Dust aerosols directly perturb the energy budget of the Earth-atmosphere system by scattering/absorbing shortwave (SW) and longwave (LW) radiation, i.e., the Direct Aerosol Radiative Effect (DARE). Studies have shown that LW DARE, relative to the SW, represents a significant impact to the regional energetics of our atmosphere. The physicochemical properties and vertical distribution of the dust layers and other key parameters (e.g., surface characteristics, etc.) play an important role. LW DARE for Asian dust (Zhangye - a land site) is examined/compared with that for African dust (Cape Verde – an ocean site) using surface measurements (http://smartlabs.gsfc.nasa.gov/) near the source. Major findings from this study are the LW DARE at Zhangye is about a factor of 2 higher than that at Cape Verde, and the corresponding LW warming compensates over one-half of the SW cooling. Leading causes of these findings are larger dust absorption, Zhangye’s close proximity to the major deserts, and stronger thermal emissions of the hot desert surfaces which can interact more readily with larger sized particles near the source . LW DARE likely plays an important role in the regional changes of surface temperatures and in the distribution of moisture and can therefore be a key component in regional climate variation. Further studies are needed to assess these radiative impacts in climate models. Earth Sciences Division - Atmospheres
Name: Richard A. Hansell Jr. Email: Richard.A.Hansell@nasa.gov Phone:301.614.6132 References: Hansell, R. A., S.C. Tsay, N.C. Hsu, Q. Ji, S.W. Bell, B.N. Holben, E.J. Welton, T.L. Roush, W. Zhang, J. Huang, Z. Li, and H. Chen (2012): An assessment of the surface longwave direct radiative effect of airborne dust in Zhangye, China, during the Asian Monsoon Years field experiment (2008), J. Geophys. Res., 117, D00K39, doi:10.1029/2011JD017370 Hansell R.A., S.C. Tsay, Q. Ji, N.C. Hsu, M.J. Jeong, S.H. Wang, J.S. Reid, K.N. Liou, and S.C. Ou (2010): An assessment of the surface longwave direct radiative effect of airborne Saharan dust during the NAMMA field campaign, J. Atmos. Sci., 67, 1048–1065 IPCC (2007) Climate Change: The Physical Science Basis. Contribution of Working Group I to the Fourth Assessment Report of the Intergovernmental Panel on Climate Change (IPCC). Cambridge University Press, New York, 2007. Lau, K.M., M.K. Kim, and K.M. Kim, 2006: Asian summer monsoon anomalies induced by aerosol direct forcing: the role of the Tibetan Plateau, Clim. Dyn., 26, doi: 10.1007/s00382-006-0114-z, 855-864 Data Sources: NASA SMARTLabs measurements (http://smartlabs.gsfc.nasa.gov); NASA Giovanni system (courtesy of NASA GES DISC), NASA LAADS Technical Description of Figures: Figure 1: Aqua MODIS Deep Blue averaged AOT (0.55µm) (from the NASA Giovanni system) during most active dust period (30 April – 6 May) of the Asian Monsoon Years (AMY) field deployment in 2008. The ‘x’ marker denotes the location of NASA SMARTLabs at Zhangye near the Taklamakan and Gobi deserts. Areas color-coded red and yellow depict high dust loading conditions, making this an ideal location for investigating the direct radiative impacts of dust aerosol. Figure 2: Aqua MODIS Level-1b visible image showing heavy dust activity on 2 May 2008 at 0650 UTC. Zhangye is marked by the yellow star. A large dust plume is clearly visible along the left side of the granule just upstream of Zhangye and was closely monitored using SMARTLab’s extensive instrument suite. Figure 3: Instantaneous LW surface DARE (Wm-2) at Zhangye (blue curve) and Cape Verde (red curve) as functions of AOT (). Data is calculated using a broadband radiative transfer model constrained by surface measurements including retrieved optical depths from the Atmospheric Emitted Radiance Interferometer (AERI). A regional dust optical model was constructed by combining previously measured soil mineralogy data at Zhangye with SMARTLab's particle microphysical measurements. Shown are the corresponding fits to the data depicting the DARE forcing efficiency (Wm-2-1): ~35 Wm-2-1 (Zhangye) vs. 16 Wm-2-1 (Cape Verde), about a factor of two difference. This is likely due to Zhangye’s close proximity to the Taklamakan and Gobi Deserts where larger sized particles interact more efficiently with LW radiation and the larger absorbing properties of the local dust aerosol. Figure 4: Diurnally averaged SW DARE forcing efficiency (Wm-2-1) at Zhangye (~60 Wm-2-1) used to compute the significance of LW DARE. The LW significance is defined relative to the SW effects (i.e., the ratio of LW to SW DARE forcing efficiencies shown in Figs. 3 and 4, respectively). The AMY study shows that over one-half of the SW cooling is compensated by LW warming, much larger than what was found during the NAMMA study (~42%). The level of significance of the LW effects are linked to how well the dust aerosol’s single-scattering albedo is constrained. Scientific significance: This study illustrates the significance of the IR radiative effects of dust aerosols over desert land sites (vs. ocean sites) where hotter surfaces emit more thermal energy which can interact more readily with larger sized particles near the source region. This study also demonstrates the importance of the regional physicochemical properties of dust at Zhangye which translates to greater particle absorption (i.e., reduced single-scattering albedo). Relative to observed/modeled ranges in surface LW DARE for clouds (~30-80 Wm-2)and greenhouse gases (~2 Wm-2), this study’s upper range in LW DARE of dust aerosol represents a significant perturbation to the climate system with important implications for better understanding regional changes in surface temperatures and moisture budgets. Relevance for future science and relationship to Decadal Survey: At regional scales near dust source regions, the LW DARE of dust is found to be climatically significant and can leverage the impact of SW cooling. Further studies are needed to fully explore these radiative effects in climate models to assess their impacts on regional climate variation. This study is part of an on-going research effort to perform more detailed and comparative analyses of LW DARE between major global source regions. Earth Sciences Division - Atmospheres
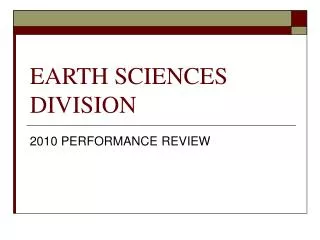
Vertical Transport of Pollution by ThunderstormsThomas F. Hanisco, Code 614, NASA GSFC The updrafts thunderstorms entrain pollutants like formaldehyde (CH2O) from the boundary layer and transport them to the upper atmosphere more than 10 km above the Earth’s surface. With over 100,000 storms occurring each year in the US, the pollutants lofted by these storms can alter ozone and clouds that impact the earth’s climate. NASA joined with NCAR (the National Center for Atmospheric Research) in the Deep Convective Clouds and Chemistry (DC3) campaign to study the chemistry of thunderstorms over the central US. NASA provided the DC8 airborne laboratory, equipped with numerous instruments that measure composition, including the new GSFC In situ Airborne Formaldehyde (ISAF) instrument that measures CH2O. These aircraft experiments were designed to determine the amount of pollutants transferred to the upper atmosphere from measurements of the inflow and outflow of the storm (Figure 1). The new measurements of formaldehyde are especially sensitive and provide new insight and quantitative constraints into convective transport. These experiments show that 40% of the CH2O in the boundary layer is transported to the upper atmosphere (Figure 2). This quantity is surprisingly high, because CH2O is soluble in water and is thought to be removed by wet deposition. Sampling of the outflow as it ages shows how CH2O is removed by ultraviolet light, a process that leads to the production of ozone. Figure 1: The NASA DC8 samples the boundary layer air that flows into a thunderstorm, spirals to high altitude, and samples the outflow. Measurements of CH2O by the GSFC ISAF instrument show the pronounced increase in CH2O in the outflow at 11 km where the CH2O abundance is usually close to zero. Figure 2: The abundance of CH2O and the aircraft altitude are shown versus time. The relative abundance in the inflow and outflow regions show that 40% of CH2O near the ground makes it to the upper atmosphere. The decrease in the outflow legs, L1 – L4 shows the photochemical removal of CH2O that produces ozone. Earth Sciences Division - Atmospheres
Name: Thomas F. Hanisco, NASA/GSFC, Code 614 E-mail: thomas.hanisco@nasa.gov Phone: 301-614-6598 References: Barth, M. C., S. –W. Kim, W. C. Skamarock, A. L. Stuart, K. E. Pickering, and L. E. Ott, Simulations of the redistribution of formaldehyde, formic acid, and peroxides in the 10 July 1996 Stratospheric-Tropospheric Experiment: Radiation, Aerosols, and Ozone deep convection storm (2007), Journal of Geophysical Research, 112, D13310, doi:10.1029/2006JD008046. Fried, A., et al. (2008), Role of convection in redistributing formaldehyde to the upper troposphere over North America and the North Atlantic during the summer 2004 INTEX campaign, Journal of Geophysical Research, 113, D17306, doi:10.1029/2007JD009760. Data Sources: The formaldehyde measurements are from the NASA Goddard Space Flight Center’s In Situ Airborne Formaldehyde (ISAF) instrument. http://airbornescience.nasa.gov/sites/default/files/documents/ISAF_SEAC4RS.pdf. TheDC3 mission description can be found at: http://www.eol.ucar.edu/projects/dc3/ Technical Description of Figures: Figure 1: The storm-chase flights during the DC3 experiment sampled isolated storms within a pre-determined region over Colorado, Oklahoma and Alabama. Each of these regions was equipped with mobile radar and lightning mapping arrays. During these flights the NASA DC8 was directed to the sampling region before the storm developed by ground-based mission directors with access to mobile radars, lightning mapping arrays, and satellite imagery. Knowledge of the real time winds and lightning are used to direct the DC8 to sample the inflow region of a probable storm and to avoid dangerous encounters with updrafts and lightning as the storm develops. In this example flight of 20120518 several nascent storms were sampled, but only this one developed into a deep convective event. The profile of CH2O is typical of these types of storms. Figure 2: The time series of the DC8 flight on 20120518 shows the measurements of CH2O with 1-s time resolution as the DC8 flies several legs in the inflow region, then spirals up to the outflow region where it makes several passes through the outflow anvil. The DC8 samples the inflow by making several crescent or L-shaped passes at different altitudes in the boundary layer. The legs are wide enough to oversample the inflow region. The spiral samples clean air adjacent to the storm. The outflow is sampled on the leeward side of the storm, in this case the eastern edge. The sampling legs of the outflow are staggered to sample progressively older regions. The photochemical lifetime of formaldehyde is approximately 2 hours in the outflow region so that each leg shows a small reduction in CH2O compared to the last. The fast time response and precise measurement of CH2O are critical to discerning this structure in the outflow due to the photochemical removal. The abundance increases after 6:00 CST as the aircraft descends back through the polluted boundary layer. Relevance for future science and relationship to Decadal Survey: Quantifying transport of short-lived species in convective events and studying the chemical, temporal, and spatial evolution in their vicinity is a high priority objective laid out by the Decadal Survey. Of particular interest is the role of short-lived species that are emitted from anthropogenic and biogenic sources in the planetary boundary layer. A key feature of these species is that their abundance in the UT/LS is strongly influenced by convective transport, a process that is poorly constrained in models. The new GSFC ISAF instrument provides measurements that are precise enough to measure the background abundance (0.1 ppbv) and the enhancements from the outflow at 1-s time resolution. This new capability allows NASA scientists to clearly identify convective outflow and to accurately determine the quantities involved in the transport. These types of measurements will be used to quantify the role of anthropogenic and biogenic emissions on ozone photochemistry and cloud microphysics in the upper troposphere and lower stratosphere. Formaldehyde is measured by existing (Aura) and planned (GEO_CAPE and GACM) NASA satellite instruments. These missions benefit from measurements of CH2O like in Figure 1 to help define measurement requirements, develop retrieval algorithms and for validation. Earth Sciences Division - Atmospheres