Download
1 / 29
290 likes | 376 Views
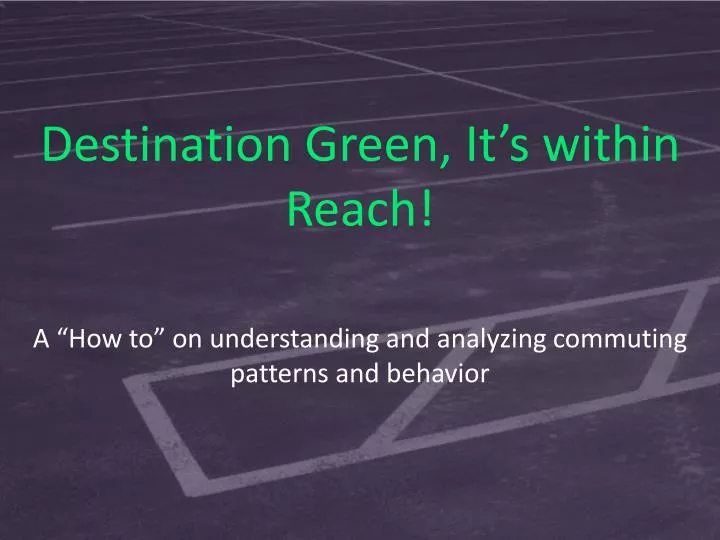
Destination Green, It’s within Reach! A “How to†on understanding and analyzing commuting patterns and behavior. Availability of Alternative Transportation. Overview of project Funded through NYSERDA and NYSDOT Partnership between Planning & Geography department Parking & Mass Transit

E N D
Destination Green, It’s within Reach!A “How to” on understanding and analyzing commuting patterns and behavior
Availability of Alternative Transportation • Overview of project • Funded through NYSERDA and NYSDOT • Partnership between • Planning & Geography department • Parking & Mass Transit • Office of Institutional Research • Nearby state office buildings • Project began in Feb 09 and ended Aug 10
Availability of Alternative Transportation • Reasons for project • Document commuting patterns of the campus community • Gain a better understanding of the alternative transportation options available • Gain insight as to the reasons why commuters don’t use mass transit/carpool and identify effective incentives • Foster collaborative projects with nearby entities and transit authorities • Create a handbook for other institutions to use
Availability of Alternative Transportation • Overview of project • GIS analysis on parking permits issued on campus • GPS analysis on bus schedules • Analysis of current mass transit options • Incorporation of data from other state agencies • Campus transportation survey • Focus groups to analyze use and marketing opportunities • Final report
Availability of Alternative Transportation • Which things can we influence? • Understand availability of alternative transportation strategies • Carpooling, vanpooling, car sharing, mass transit, bike sharing, safe opportunities to bike/walk • Communicating options available in a successful manner • Awareness and accessibility of information • Pamphlets, fliers (electronic and yes, hard copy), special event days, incorporation with established outreach such as orientation (both employees and students)
Availability of Alternative Transportation • Main finding on accessibility and availability of alternative transportation. • It is difficult for a UAlbany commuter to take bus transportation outside of the immediate area • Most transit buses make one stop on campus between 7 and 7:30 am and pick up around 4 pm. • There is a lack of awareness about programs. • An abundance of information and resources available as to bus routes and park and rides via the CDTC. However, it is difficult to get commuters to take advantage of their services. • There are concerns with safety in biking and walking to campus which would need to be addressed through city infrastructure changes.
Availability of Alternative Transportation • GIS analysis • GIS: geographic information systems • Parking permit data from fall 2008 obtained from Parking & Mass Transit • Graduate student performed GIS analysis based on zip codes to determine commuting density patterns • These patterns are being matched against mass transit routes
Availability of Alternative Transportation • Overview of GIS analysis was performed on parking permit data • Able to identify clusters of commuting population to encourage and identify carpool and vanpool opportunities. • Able to identify commuting commonalities between UAlbany and Harriman campus employees. • About half of employee commuters living in Albany, Rensselaer and Schenectady counties are being served by a CDTA bus line within a 1/4 mile of their home.
Top postal codes of student commuters out of 9,839 permits
On-Time Performance Analysis • Using GPS to Evaluate the Effectiveness and Reliability of Mass Transit Serving the University at Albany • GPS – global positioning system • A protocol on gathering GPS data was developed by a graduate student • Undergraduate students were hired to ride bus routes (both university and city fleet) and gather GPS data • This data was analyzed against stated bus schedules to determine on time reliability
Unit of Analysis Map of CDTA Route 12 • The transit routes under investigation in this study include CDTA routes 11 and 12 and the UAlbany Shuttle routes that serve Western Ave and Madison Ave • The map shown on the right illustrates CDTA route 12 • The blue line indicates the path the bus traveled and the red dots are timing points
Deployment • The deployment of the study occurred for three weeks during the fall semester • A total of nineteen student workers were trained to ride the bus routes being studied and collect GPS data • The GPS data has been post-processed and converted to a file format compatible with Microsoft Excel for analysis
On time percentage and reliability • Mean provides on time percentage of bus route • Standard deviation indicates reliability of route • Low s.d. indicates a consistent level of service Statistical Analysis of Routes On time percentages Mean Stand. Dev. • CDTA Route 11 71.4% 8.90 • CDTA Route 12 65.8% 17.20 • UAlbany- Madison 64.8% 9.90 • UAlbany- Western 60.2% 7.90
Both transit operators were found to have approximately 65 percent of departures on-time The percentage of late departures was found to be minimal and not problematic Approximately 33 percent of departures for both transit operators were found to be early Both transit agencies need to address the high percentage of early departures in order to provide a higher level of service The use of an Automatic Vehicle Location (AVL) system is the recommended method of conducting future on-time performance studies GPS analysis summary
Survey Overview • Campus transportation survey • Completed in conjunction with professor of geography and planning, institutional research and advisory committee • Draft based on previous survey distributed at state offices and city transit authority • Survey issued on line, approximately 815 employees and 1265 students participated in the survey • Sample provided a good representation of the campus composition with a slight overrepresentation of females.
Survey Results: Employee Commuting Modes • 40% commute between 3 and 15 miles • 16% commute over 30 miles • Average time of commute is 21 – 30 minutes • 89% use car when travelling from campus to campus
Survey Results: Student Commuting Modes • 75% live within 10 miles of campus • Average commute time is 11 to 15 minutes • When travelling from one campus to another: 49% take a CDTA bus, 46% Drive, 43% take the UAlbany shuttle, 14% walk, 2% bike
Survey Results: Top problems in commuting Employees Students
Survey Results: Top reasons preventing people from using alternative transportation Employees Students
Survey Results: Most desired bus services Employees Students
Focus groups gathered to provide more in depth response to commuting patterns. Total of six stakeholder focus groups were formed. 4 student groups, 1 faculty, 1 staff Student groups broken down into on campus, off campus (male and female) and graduate student Conducted during a two week span between March 15th and 24th 2010. Focus groups
Added insight garnered from Focus Groups • Prevalence of driving for students due to convenience, home travel, mall access • Low use of alternative transportation and carpooling among faculty and staff due to daycare access, preference for personal/alone time in car • Supported rewards for using alternative transportation included gift and food certificates, podium money, and reduced student fees • Reasons behind non-use of transit: distrust of bus reliability during high stress periods (such as tests)
Suggestions for future research • Pair information on alternative transportation with information about parking, send information in the annual email notice to renew parking permits. • Research the participants that are already using the carpooling service to analyze their usage and location. • Continue to re-administer the survey on a regular basis to assess changes in commuting patterns. • Look into partnership opportunities • Market carpooling more aggressively to off-campus student commuters as well as commuters living in high density clusters • Explore options to increase the price of parking to act as a deterrent for SOV use. • Consider adding a fuel efficient/hybrid vehicle category as a separate color coded parking permit. • Explore whether it is feasible to register employees and students up for carpooling and ridesharing programs when applying for parking permits.
Lessons Learned • Partnerships are key to success • In our case: the department of mass transit, the local transit authority, a regional transportation committee and office of general services for NYS all cooperated in this endeavor • This was aided by having alumni in key positions, being part of key groups (such as the Capital District Clean Cities Coalition) and networking • Lots of planning and setting a realistic timeline • Be sure to identify tasks need along the way: ex: IRB process, hiring of students, plan one semester ahead • Having enough resources to complete task
Lessons Learned • Recognize factors beyond your control (but some you can influence!!) • Mass transit options available • Schedule and location of current mass transit opportunities • Supporting infrastructure for biking and walking • Behavior of your commuting population • Price of gas, mass transit and price of parking permits • Availability of on campus parking
Contact information • Mary Ellen Mallia • Director of Environmental Sustainability • University at Albany • mmallia@albany.edu • University Hall 212 • 518-956-8120 • www.albany.edu/gogreen • Handbook available at: • http://www.albany.edu/gogreen/transportation2.shtml Questions?