Download
1 / 1
10 likes | 154 Views
The Impact of Probabilistic Information on Deterministic & Threshold Forecasts Susan Joslyn, Earl Hunt & Karla Schweitzer University of Washington. EXPERIMENT

E N D
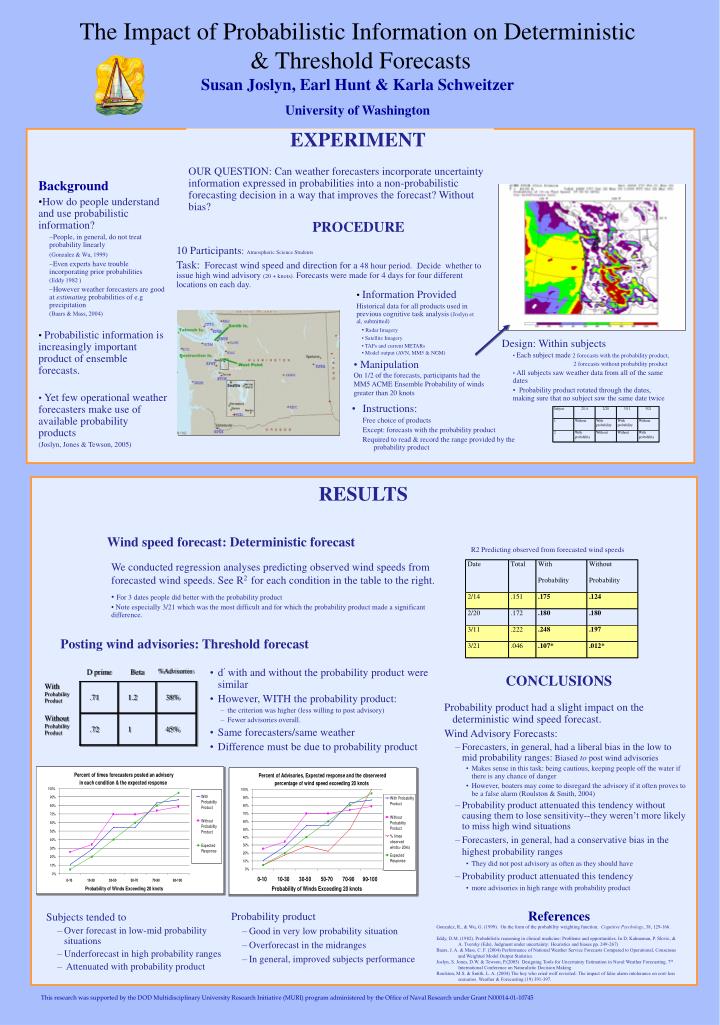
The Impact of Probabilistic Information on Deterministic & Threshold Forecasts Susan Joslyn, Earl Hunt & Karla Schweitzer University of Washington • EXPERIMENT • OUR QUESTION: Can weather forecasters incorporate uncertainty information expressed in probabilities into a non-probabilistic forecasting decision in a way that improves the forecast? Without bias? • Background • How do people understand and use probabilistic information? • People, in general, do not treat probability linearly • (Gonzalez & Wu, 1999) • Even experts have trouble incorporating prior probabilities • (Eddy 1982 ) • However weather forecasters are good at estimating probabilities of e.g precipitation • (Baars & Mass, 2004) • Probabilistic information is increasingly important product of ensemble forecasts. • • Yet few operational weather forecasters make use of available probability products • (Joslyn, Jones & Tewson, 2005) PROCEDURE 10 Participants: Atmospheric Science Students Task: Forecast wind speed and direction for a 48 hour period. .Decide whether to issue high wind advisory (20 + knots). Forecasts were made for 4 days for four different locations on each day. • Information Provided • Historical data for all products used in previous cognitive task analysis (Joslyn et al, submitted) • Radar Imagery • Satellite Imagery • TAFs and current METARs • Model output (AVN, MM5 & NGM) • Design: Within subjects • • Each subject made 2 forecasts with the probability product, • 2 forecasts without probability product • • All subjects saw weather data from all of the same dates • • Probability product rotated through the dates, making sure that no subject saw the same date twice • Manipulation • On 1/2 of the forecasts, participants had the • MM5 ACME Ensemble Probability of winds • greater than 20 knots • Instructions: • Free choice of products • Except: forecasts with the probability product • Required to read & record the range provided by the probability product RESULTS Wind speed forecast: Deterministic forecast R2 Predicting observed from forecasted wind speeds • We conducted regression analyses predicting observed wind speeds from forecasted wind speeds. See R2 for each condition in the table to the right. • For 3 dates people did better with the probability product • Note especially 3/21 which was the most difficult and for which the probability product made a significant difference. Posting wind advisories: Thresholdforecast • d with and without the probability product were similar • However, WITH the probability product: • the criterion was higher (less willing to post advisory) • Fewer advisories overall. • Same forecasters/same weather • Difference must be due to probability product CONCLUSIONS Probability product had a slight impact on the deterministic wind speed forecast. Wind Advisory Forecasts: • Forecasters, in general, had a liberal bias in the low to mid probability ranges: Biased to post wind advisories • Makes sense in this task: being cautious, keeping people off the water if there is any chance of danger • However, boaters may come to disregard the advisory if it often proves to be a false alarm (Roulston & Smith, 2004) • Probability product attenuated this tendency without causing them to lose sensitivity--they weren’t more likely to miss high wind situations • Forecasters, in general, had a conservative bias in the highest probability ranges • They did not post advisory as often as they should have • Probability product attenuated this tendency • more advisories in high range with probability product References Gonzalez, R., & Wu, G. (1999). On the form of the probability weighting function. Cognitive Psychology, 38, 129-166. Eddy, D.M. (1982). Probabilistic reasoning in clinical medicine: Problems and opportunities. In D. Kahneman, P. Slovic, & A. Tversky (Eds), Judgment under uncertainty: Heuristics and biases pp. 249-267) Baars, J. A. & Mass, C. F. (2004) Performance of National Weather Service Forecasts Compared to Operational, Consensus and Weighted Model Output Statistics. Joslyn, S. Jones, D.W. & Tewson, P.(2005) Designing Tools for Uncertainty Estimation in Naval Weather Forecasting. 7th International Conference on Naturalistic Decision Making Roulston, M.S. & Smith, L. A. (2004) The boy who cried wolf revisited: The impact of false alarm intolerance on cost-loss scenarios. Weather & Forecasting (19) 391-397. Probability product • Good in very low probability situation • Overforecast in the midranges • In general, improved subjects performance Subjects tended to • Over forecast in low-mid probability situations • Underforecast in high probability ranges • Attenuated with probability product This research was supported by the DOD Multidisciplinary University Research Initiative (MURI) program administered by the Office of Naval Research under Grant N00014-01-10745