Download
1 / 28
340 likes | 1.58k Views
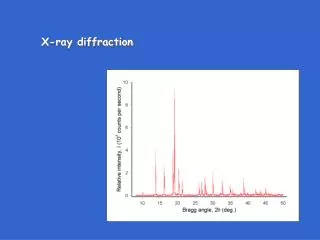
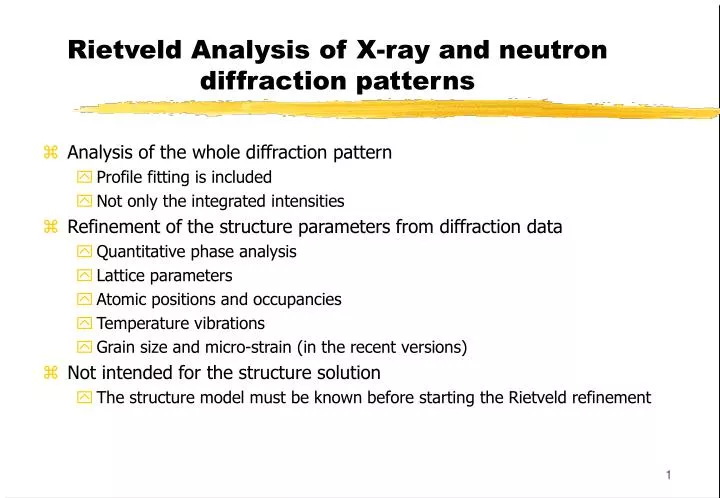
Rietveld Analysis of X-ray and neutron diffraction patterns. Analysis of the whole diffraction pattern Profile fitting is included Not only the integrated intensities Refinement of the structure parameters from diffraction data Quantitative phase analysis Lattice parameters

E N D
Rietveld Analysis of X-ray and neutron diffraction patterns • Analysis of the whole diffraction pattern • Profile fitting is included • Not only the integrated intensities • Refinement of the structure parameters from diffraction data • Quantitative phase analysis • Lattice parameters • Atomic positions and occupancies • Temperature vibrations • Grain size and micro-strain (in the recent versions) • Not intended for the structure solution • The structure model must be known before starting the Rietveld refinement
Non-refinable parameters in the Rietveld method • Space group • Chemical composition • Analytical function describing the shape of the diffraction profiles • Wavelength of the radiation (can be refined in Fullprof or in LHRL; suitable for the synchrotron data) • Intensity ratio in Ka1, Ka2 doublet • Origin of the polynomial function describing the background
History H.M. Rietveld - neutron data, fixed wavelength D.E. Cox - X-ray data R.B. Von Dreele - neutron data, TOF D.B. Wiles & R.A. Young - X-ray data, 2 wavelengths, more phases Helsinki group - spherical functions for preferred orientation but a single wavelength Fullprof, LHRL - surface absorption BGMN - automatic calculation, crystallite size and microstrain in form of ellipsoids P. Scardi et at - size, strain Computer programs H.M. Rietveld DBW2.9, DBW3.2 (Wiles & Young) University of Helsinki Fullprof (J. Rodriguez-Carvajal) BGMN (R. Bergmann) LHRL (C.J. Howard & B.A. Hunter) P. Scardi et al. Bärlocher GSAS Rietveld analysis
Integral intensity • Calculated intensity: G is the normalised profile function, I is the intensity of the k-th reflection. The summation is performed over all phases p, and over all reflections contributing to the respective point. • The intensity of the Bragg reflections
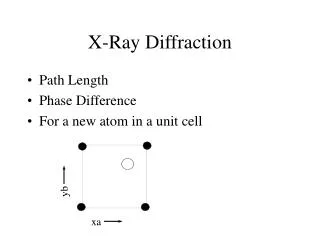
Scattering by one elementary cell • Structure factor • Calculation is performed in the oblique axes (for the respective crystal system)
Temperature vibrations • Atomic displacement (in Cartesian co-ordinates)
Crystal symmetry restrictions • Six anisotropic temperature factors per atom in a general case (symmetrical matrix) • For an atom in a site of special symmetry the B-matrix must be invariant to the symmetry operations (in the Cartesian axis system) • An example - rotation axes parallel with z
Temperature vibrations - special cases • Isotropic atomic vibrations • Overall temperature factor
Scattering by one atom • Atomic scattering factor • a, b, c are from the “International Tables for Crystallography” • Df’, Df” must be checked and changed for synchrotron radiation • Another possibility • Include our set of the atomic scattering factors
Preferred orientation of grains (texture) • Gauss-like distribution • March-Dollase correction • Spherical functions
Absorption correction • For flat samples - micro-absorption and surface absorption (Hermann & Ermrich) • Apparent decrease of the temperature factors or even “negative” temperature factors
Absorption correction • For thin samples (powder on glass) in symmetrical arrangement • thick sample, high absorption • thin sample, low absorption
Extinction correction(for large crystallites) • Extinction for the Bragg case (q = 90) • Extinction for the Laue case (q = 0)
Profile functions • Gauss • Lorentz (Cauchy) • Pearson VII • Pseudo-Voigt
Background • Subtraction of the background intensities • Interpolation of the background intensities • Polynomial function (six refinable parameters) • Origin of the background - improves the pivoting of the normal matrix • A special function for amorphous components
Minimisation routine • Uses the Newton-Raphson algorithm to minimise the quantity • Normal matrix
Reliability factors • The profile R-factor ……… • The weighted Rp ……………………………………… • The Bragg R-factor ……… • The expected Rf ……………………………………… • The goodness of fit
Connecting parameters, constrains • Young - parameter coupling • Coding of variables: number of the parameter in the normal matrix + weight for the calculated increment • Lattice parameters in the cubic system: 41.00 41.00 41.00 • Fractional co-ordinates at 12k in P63/mmc, (x 2x z): 20.50 21.00 31.00 • Fullprof - constrains • Inter-atomic distances may be constrained • BGMN - working with molecules • Definition of the molecule (in Cartesian co-ordinates) • Translation and rotation of the whole molecule
Structure of the input file(Fullprof for anglesite) COMM PbSO4 D1A(ILL),Rietveld Round Robin, R.J. Hill,JApC 25,589(1992) !Job Npr Nph Nba Nex Nsc Nor Dum Iwg Ilo Ias Res Ste Nre Cry Uni Cor 1 7 1 0 2 0 0 0 0 0 0 0 0 0 0 0 0 ! !Ipr Ppl Ioc Mat Pcr Ls1 Ls2 Ls3 Syo Prf Ins Rpa Sym Hkl Fou Sho Ana 0 0 1 0 1 0 0 0 0 1 6 1 1 0 0 1 1 ! ! lambda1 Lambda2 Ratio Bkpos Wdt Cthm muR AsyLim Rpolarz 1.54056 1.54430 0.5000 70.0000 6.0000 1.0000 0.0000 160.00 0.0000 !NCY Eps R_at R_an R_pr R_gl Thmin Step Thmax PSD Sent0 5 0.10 1.00 1.00 1.00 1.00 10.0000 0.0500 155.4500 0.000 0.000 ! ! Excluded regions (LowT HighT) 0.00 10.00 154.00 180.00 ! 34 !Number of refined parameters ! ! Zero Code Sycos Code Sysin Code Lambda Code MORE -0.0805 81.00 0.0000 0.00 0.0000 0.00 0.000000 0.00 0 ! Background coefficients/codes 207.37 39.798 65.624 -31.638 -90.077 47.978 21.000 31.000 41.000 51.000 61.000 71.000 ! Data for PHASE number: 1 ==> Current R_Bragg: 4.16 PbSO4 !Nat Dis Mom Pr1 Pr2 Pr3 Jbt Irf Isy Str Furth ATZ Nvk Npr More 5 0 0 0.0 0.0 0.0 0 0 0 0 0 0.00 0 7 0 P n m a <-- Space group symbol !Atom Typ X Y Z Biso Occ /Line below:Codes Pb PB 0.18748 0.25000 0.16721 1.40433 0.50000 0 0 0 171.00 0.00 181.00 281.00 0.00 S S 0.06544 0.25000 0.68326 0.41383 0.50000 0 0 0 191.00 0.00 201.00 291.00 0.00 O1 O 0.90775 0.25000 0.59527 1.97333 0.50000 0 0 0 211.00 0.00 221.00 301.00 0.00 O2 O 0.19377 0.25000 0.54326 1.48108 0.50000 0 0 0 231.00 0.00 241.00 311.00 0.00 O3 O 0.08102 0.02713 0.80900 1.31875 1.00000 0 0 0 251.00 261.00 271.00 321.00 0.00 ! Scale Shape1 Bov Str1 Str2 Str3 Strain-Model 1.4748 0.0000 0.0000 0.0000 0.0000 0.0000 0 11.00000 0.00 0.00 0.00 0.00 0.00 ! U V W X Y GauSiz LorSiz Size-Model 0.15485 -0.46285 0.42391 0.00000 0.08979 0.00000 0.00000 0 121.00 131.00 141.00 0.00 151.00 0.00 0.00 ! a b c alpha beta gamma 8.480125 5.397597 6.959482 90.000000 90.000000 90.000000 91.00000 101.00000 111.00000 0.00000 0.00000 0.00000 ! Pref1 Pref2 Asy1 Asy2 Asy3 Asy4 0.00000 0.00000 0.28133 0.03679-0.09981 0.00000 0.00 0.00 161.00 331.00 341.00 0.00
Quantitative phase analysis • Volume fraction • Weight fraction Use the correct occupancies : N = occupancy / max # of Wyckoff positions
Instrumental parameters Scale factor (always) Background (1) Line broadening and shape (3) Zero shift (4) Sample displacement or transparency (5) Preferred orientation (7) Surface absorption (7) Extinction (7) Structure parameters Scale factor (always) Lattice parameter (2) Atomic co-ordinates (6) Temperature factors (8) Occupancies (8), N = occ/max(N) important for quantitative phase analysis Tips and tricks (on the course of the refinement)
Tips and tricks (how to obtain reliable data) • Use only good adjusted diffractometer • Bad adjustment causes the line shift and broadening; the latter cannot be corrected in the Rietveld programs • Use only fine powders • Coarse powder “randomises” the integral intensities • Coarse powder causes problems with rough surface • Use sufficient counting time • The error in intensity is proportional to sqrt(N) as for the Poisson distribution • Apply dead-time correction • For strong diffraction lines, the use of the dead-time correction is strongly recommended
Effect of the grain size • Variations in observed intensities (bad statistics) Figure: Effect of specimen rotation and particle size on Si powder intensity using conventional diffractometer and CuKa radiation. International Tables for Crystallography, Vol. C, ed. A.J.C. Wilson, Kluwer Academic Publishers, 1992.
In the Rietveld refinement don’t • refine parameters which are fixed by the structure relations (fractional co-ordinates, lattice parameters) • refine all three parameters describing the line broadening concurrently • refine the anisotropic temperature factors from X-ray powder diffraction data • use diffraction patterns measured in a narrow range • forget that the number of structure parameters being refined cannot be larger than the number of lines
Auxiliary methods and computer programs • The most critical parameters for the convergence of the Rietveld refinement - lattice parameters • FIRESTAR • Only the crystal system must be known (not the space group) • The diffraction pattern must be indexed
Problems with positions of diffraction lines • Residual stresses in bulk materials • Anisotropic deformation of crystallites (anisotropy of mechanical properties) • Presence of errors in the structure (stacking faults, …) • Use of the programs working with net integral intensities (POWOW, POWLS) is recommended • How to get the net intensities? • Numerical integration (not for the overlapped lines) • Profile fitting using analytical functions (for overlapped lines) - DIFPATAN
Indexing of the diffraction patternin unknown phases • Computer program TREOR (Trials and Errors) • Requirements • A single phase in the specimen • High-quality data (particularly, the error in the positions of diffraction lines must not exceed 0.02° in 2q) • Very good alignment of the diffractometer or the use of an internal standard (mixed to the specimen)